How Does Antenna Choice Impact Your RAIN RFID System?
Selecting the right antenna can make or break the performance of a RAIN RFID system. Our recent webinar on October 10, “Choosing the Right RAIN RFID Antenna”, provided a deep dive into the critical aspects of antenna selection for RAIN RFID systems.
We explored the fundamental principles of antenna choice, essential parameters to consider, and ways to match antenna features with specific application needs.
The webinar featured insights from industry experts including Daniel Eisen, RFID Engineer at Times-7, Jos Kunnen, CTO at Times-7, along with Sami Rautanen, Senior Hardware Designer, and Teemu Ainasoja, Sales Director, both from Voyantic.
Together, they shared valuable insights into antenna fundamentals, best practices, and considerations for optimizing RFID system performance.
Key Highlights of the Webinar
- Key Factors in Antenna Selection
- RF Fundamentals in RAIN RFID Systems
- Choosing the Best Antenna Polarization for Your Needs
- Practical Advice for Antenna Selection
- Questions to Ask Your Antenna Supplier
Key Factors in Antenna Selection
Every application has unique requirements, so understanding the essential factors in antenna selection is crucial. Our speakers discussed parameters like frequency, wavelength, and RF (Radio Frequency) characteristics, all of which affect how antennas interact with RFID tags in various environments.
- Frequency and radiation pattern: Each antenna has an operating frequency. RAIN RFID operates in 860 – 960 MHz, so make sure you choose the right antenna for your reader. Understanding the radiation pattern is important in order to read the datasheet and select the best antenna for your application.
- RF Characteristics: Factors such as RF field strength and energy distribution influence how well an RFID system reads tags, especially in environments with metal, liquids, or other RF interference sources.
RF Fundamentals in RAIN RFID Systems
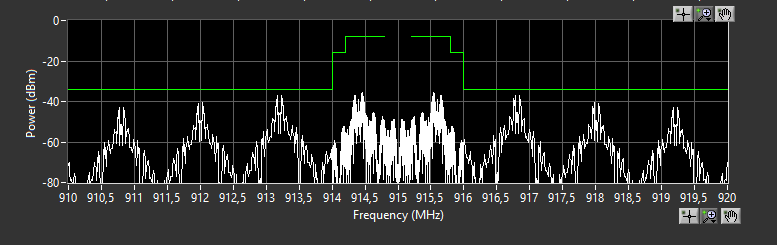
RAIN RFID technology relies on RF signals in the UHF range of 860-960 MHz. Understanding the behavior of these signals is key to optimizing system performance.
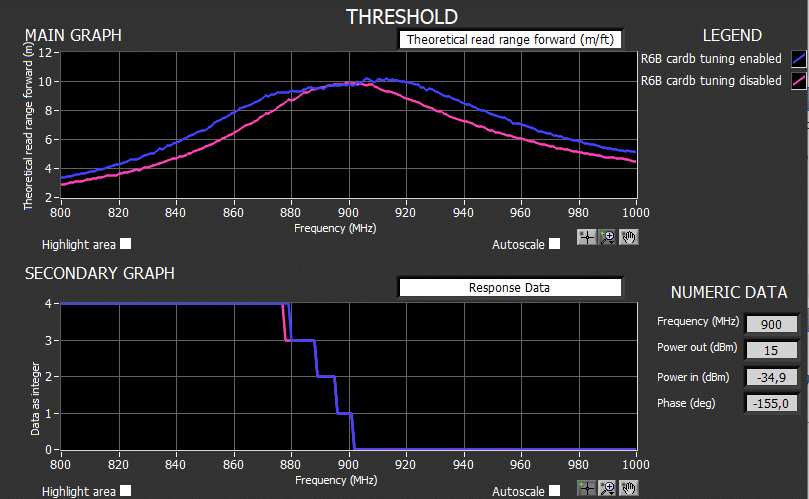
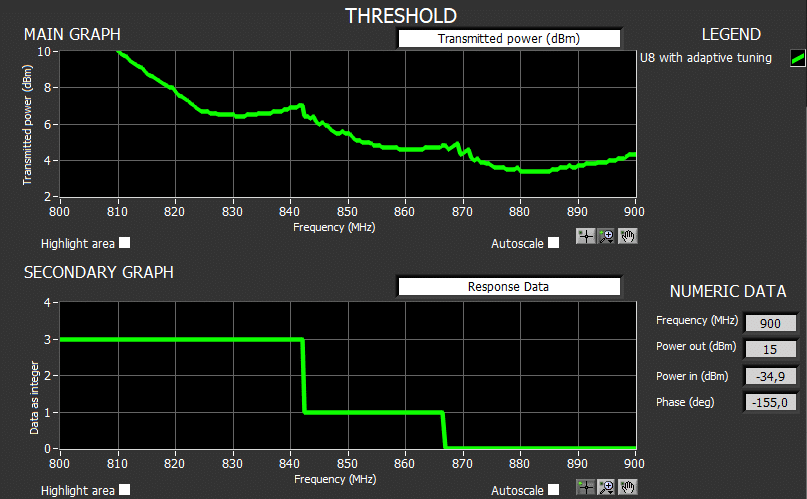
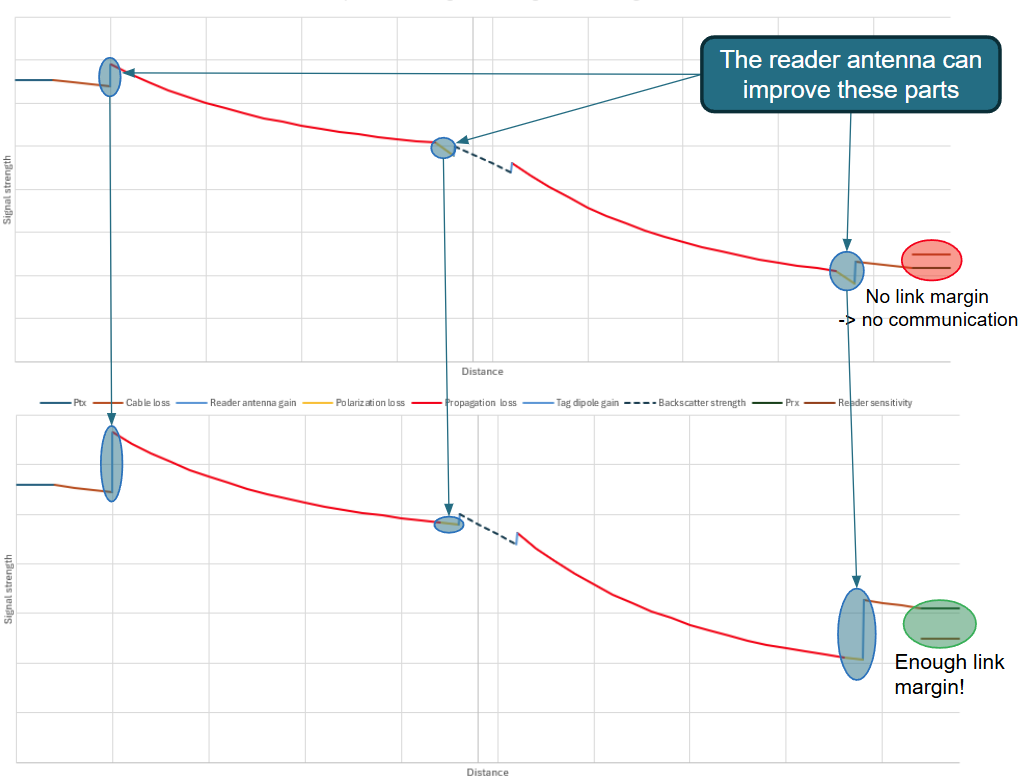
- Link Budget: Losses in the RF link may cause excessive signal loss and destroy system performance. This problem can be solved with a right reader antenna with a suitable radiation pattern and polarization.
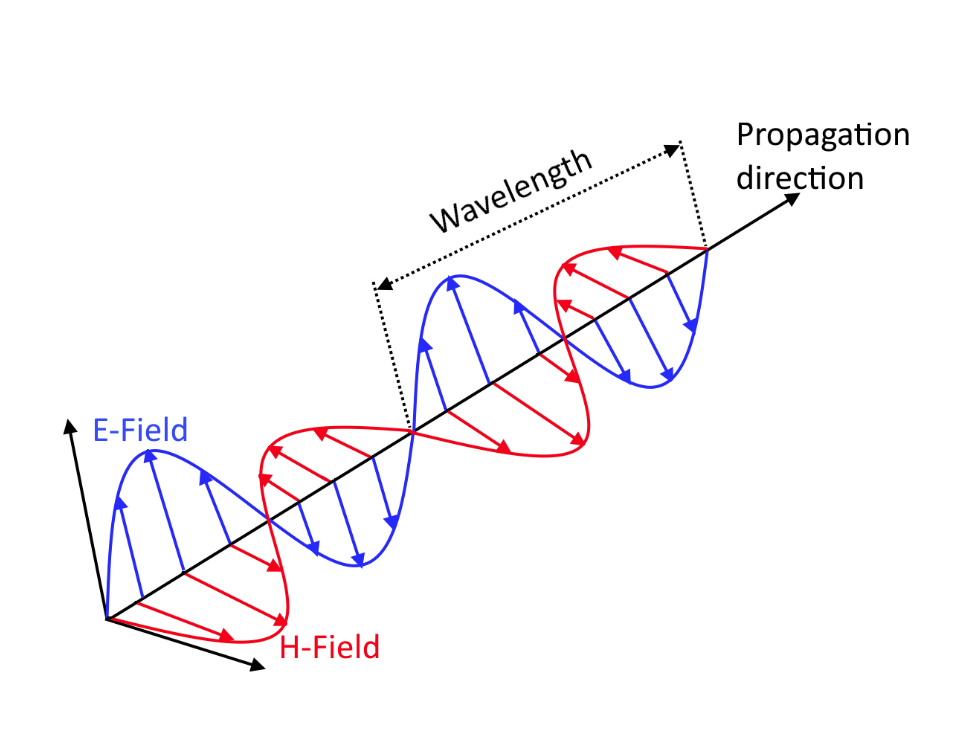
- Signal Polarization: The webinar explained how linear and circular polarization can impact read accuracy and range. Linear polarization works well for specific orientations, while circular polarization offers flexibility for tags at various angles.
Choosing the Best Antenna Polarization for Your Needs
Polarization is central to antenna effectiveness. Our experts explained how different polarization types function and when to use each based on application requirements.
- Linear Polarization: Suitable for applications where tags are consistently aligned with the antenna. It provides strong signals in a specific direction, ideal for scenarios with controlled orientation.
- Circular Polarization: A versatile choice when tag orientation is unpredictable, as it allows signals to be read from various angles. This reduces errors in environments like retail, where items may shift.
Practical Advice for Antenna Selection
Our webinar offered practical tips for balancing gain, beamwidth, and radiation patterns—critical parameters that influence coverage and reliability.
- Gain: Higher gain antennas provide a stronger, focused signal ideal for long-range reads, whereas low-gain antennas are better suited for wider coverage in close proximity setups.
- Beamwidth and Radiation Patterns: These factors determine how broadly the antenna transmits signals. For example, narrow beamwidth is optimal for focused, direct reads, while a wider beam is suitable for scanning larger areas with multiple tags.
Questions to Ask Your Antenna Supplier
To conclude, our experts provided a checklist of questions to ask when selecting an antenna supplier. Knowing terms like dBi, EIRP, and ERP, as well as understanding compliance requirements, allows you to make informed decisions that ensure efficiency and regulatory alignment.
- dBi (Decibel Isotropic): A measure of an antenna’s gain compared to an idealized isotropic antenna. Higher dBi indicates a more focused signal.
- EIRP (Equivalent Isotropically Radiated Power) and ERP (Effective Radiated Power): These metrics help determine the actual power output and range capacity, both essential for meeting regulatory standards.
Watch the Webinar On-Demand
Did you miss the live session? You can still access the full recording here.
The webinar is packed with expert insights to help you make confident, data-driven decisions for your RAIN RFID applications.
All blog posts