
Testing Tags for ETSI EN 302 208
May 05, 2023
We are getting a fair amount of questions on “how to approach ETSI EN 302 208” and I figured I would first give you all the painful details and then summarize what I believe is the right advice. My message is: EN302 208 testing can be made really fast and easy. Read on to find out how!
A bit of history
Right from the early days of the European Union and the UHF band RFID, the “EN 302 208” has been the well-known and unified standard describing how to set up and test RFID equipment to be declared as radio devices in Europe.
The first version was published back in 2004 describing reader requirements, but also briefly touching on the subject of RFID tags by setting a limit for their out-of-band spurious emissions. Most probably this was taken more as input by reader designers to limit Back Link Frequency (BLF) in their ETSI mode, and not really as impacting the work of tag designers. After all, it’s the reader that sets the carrier frequency, and power level and has command over all of the tag’s settings, right?
Well, nine standard versions later we are now at v3.3.1 which has limits for both tag out-of-channel emissions as well as outright limits for backscatter levels both for the ~865 MHz “lower” and ~915 MHz “upper” band ETSI channels. In the last few years, tag manufacturers’ interest to produce and offer labels fulfilling the standard has steadily grown. Most probably as a result of RAIN technology entering new market verticals with longer and stricter traditions of following all kinds of standards.
Feels a bit complicated, why is it so?
The standard has been a tough one for tag manufacturers to decipher as it is written in the form of a traditional EMC standard talking about power spectral densities, transmit masks, and resolution bandwidths.
This makes it harder to compare the limits against more typical RFID tag results that we have gotten accustomed to, such as “power on tag reverse”. However, the greatest layer of fuzziness comes from the fact that the standard is a generic standard, as it understandably needs to be, providing absolutely no help in associating the tests with RAIN technology, GS1 Gen2 protocol, and the equivalent ISO counterpart 18000-63 that 99% of all the UHF tags utilize. This unfortunately leaves a lot of room for interpretation.
The actual test to be performed, according to the standard, sounds relatively straightforward: 1) Radiate the tag by a field strength equivalent to 2W ERP from 20cm away. 2) Record the tag’s modulation spectrum. 3) Compare against limits. Well, a tag doesn’t backscatter anything on its own unless a proper command is given. So, a command is needed in the form of Query, Query+Ack or Query+Ack+ReqRN+Read. For the lower band a BLF of ~300kHz should be targeted and for the upper band ~600kHz. In Gen2, these in practice will often be rounded up to 320kHz and 640kHz as those are the frequencies that all tag ICs can divide their clock down to. The problems arise trying to capture the tag’s response with a spectrum analyzer. The response is always very short, typically only a few hundred microseconds and inconveniently only some 30 µs apart from the immensely more powerful command itself. Accidentally analyze any part of the command or any part of the silence after the tag’s answer and the outcome will be hugely incorrect.
So what is left for interpretation?
According to the standard, the answer should be recorded with a resolution bandwidth of 1kHz around the carrier frequency. This indirectly implies that the answer should be much greater than 1ms for this to be even theoretically possible. So, the exact correct resolution bandwidth can rarely be used except for some high Miller modes in combination with the lower ETSI band’s lower BLF.
This brings us to the perhaps biggest question: Which modulation type and data content should be used in the tests, and is the test supposed to be passed for all of these modes, a typical one, or for any selected single mode of use? The difference in passing or failing the test can be as big as 15 dB between these several modes! In simple terms, a tag that always modulates with a fixed amplitude between the same two impedance states while backscattering will always produce an equal amount of total backscatter power. What is different, is how spectrally spread or focused this power will be. And for the ETSI test, what is recorded in the end, is the strength of the peak spectral feature. So, it will be much easier to pass the test with the power spread across the frequencies as evenly as possible.
Let’s compare the spectra
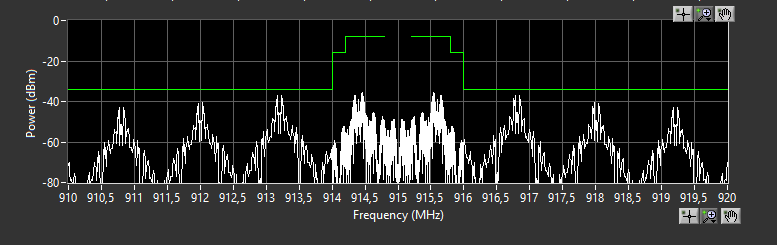
The absolute worst case for the ETSI tag emission test will be a “continuous square tone”. That is, a symmetric square wave modulation as in the case of sending a long train of data zeros with FM0 decoding. The same square wave modulation also happens in the miller modes when the extended preamble is requested by the reader. The square-wave backscatter modulation of the tag will create a Fourier-series type of spectrum with almost all of the power concentrating on exactly carrier +/- (n*BLF), where n is an odd integer. This is the absolute most difficult mode to pass the test with and that’s why in the Tagformance system this is referred to as the “worst case” from release version 13.5 onwards. Pass this and you will pass everything else too with no need to test for anything else.
Ironically, if FM0 is the “worst case” to pass, it is also the “easiest case” when the packet data is randomized. Having a roughly equal distribution of zeroes and ones in random patterns will with high probability create a very spread out spectrum. A spectrum with no predictable high peaks which could breach the mask and fail the test.
Somewhere between the worst and easiest cases fall all the Miller modes producing their tell-tale double-peak “rabbit ear” spectra. Miller modes, ranging from M2 through M4 to M8, are often favored by the readers for their decode sensitivity. This is why we have chosen the M4 with a randomized data packet to be our most “typical case” for tag emission testing.
The Voyantic way
Currently, Voyantic offers two approaches in the Tagformance system to test for tag emissions. The perhaps more traditional and thorough approach makes use of a separate calibrated Rohde-Schwarz spectrum analyzer which is synchronized to the Tagformance system to record just at the correct moment and for the correct duration to hit the tag answer.
The alternative method is the “simulated spectrum” method, as it is referred to in the Tagformance user interface. Despite its name, it is a tag measurement, where the tag backscatter is measured for amplitude and frequency. The point where a measurement turns into a simulation is when the measured parameters are taken to recreate a prototype of a waveform, the spectrum of which is then evaluated against the mask limits. The simulation assumes a sharp backscatter modulation between two discrete states utilizing a random data packet which is selected to be as average and representative as possible. This is very close to reality, and what is important, is that the reality can only be more forgiving. So, if you pass with the simulation, you will pass in the spectrum analyzer measurement too. The great advantage of a recreated data packet is that it can be created to be of any suitable length and thus analyzed with any resolution bandwidth.
Conclusion
An easy option is to take the EN302 208 testing as a part of the design process as the testing can be made really fast and easy. It is adequate to use the simulated mode as in reality, things are not going to be worse. So if you pass, you pass.
This really means that the measurement system and setup are exactly the same as you would use for tag measurements.
Using Tagformance Pro and a Voyantic measurement cabinet, the result is just a few clicks and a few seconds away at any given time. Simply place the tag on the measurement platform as you would with e.g. threshold or read range measurements and run the tag emission test.
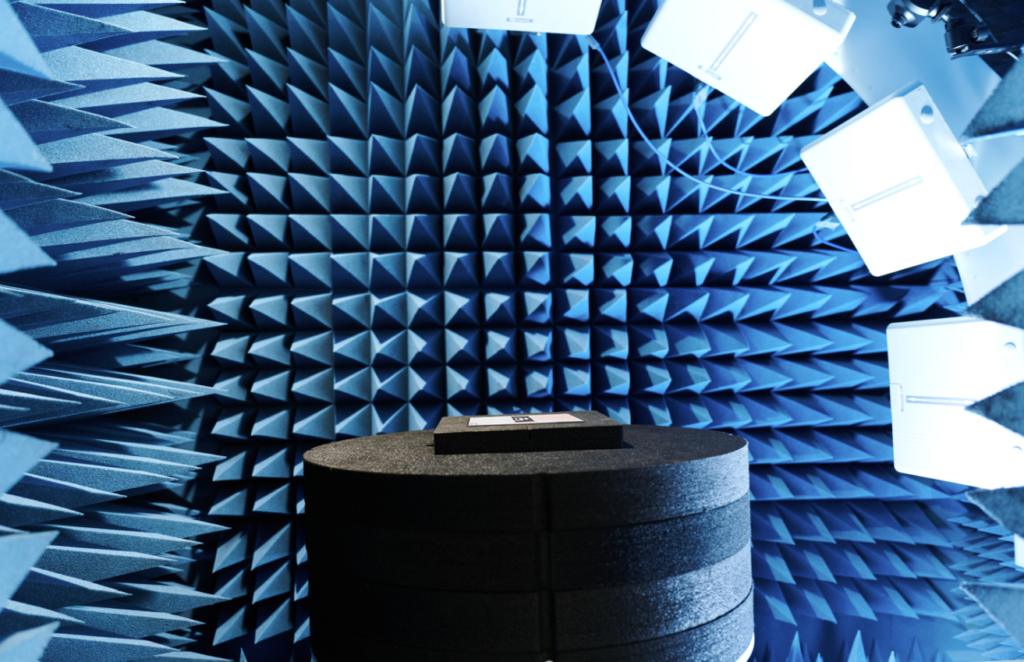
Finally, Just wanted to take this opportunity to mention that our C50 cabinet has a really nice very-low-echoic rotation system, and having a Tagformance Pro and C50 on one’s lab enables truly complete measurement capabilities from basic frequency response (threshold, read range) measurements to EN302 208 and ARC pre-testing. All in one system, easy to buy and use – and to maintain for several years to come.
Ah, one more thing, get the latest version of Tagformance Pro UHF software to have the well-recommended “typical” simulated results at your disposal! No spectrum analyzer? No problem!