How to Win Sales with Good RAIN RFID Test Data
Dec 29, 2015
When selling RAIN RFID tags: wouldn’t it be great to prove that the proposed tag is the best possible one for the customer’s application instead of just sending out loads of free samples hoping that the customer tests them properly? And when purchasing: wouldn’t it be great to have comparable data of how each tag works in your application instead of “our tags are the best ones, you can trust us” statements?
Guess what: it is possible, and in most cases, the salesperson or the buyer just needs to know what to ask. Tag developers have a lot of characterization data ready. Read on to see how to leverage that data following the 3-step approach!
Step 1: Extract Tag Characterization Data from the Production Quality Log
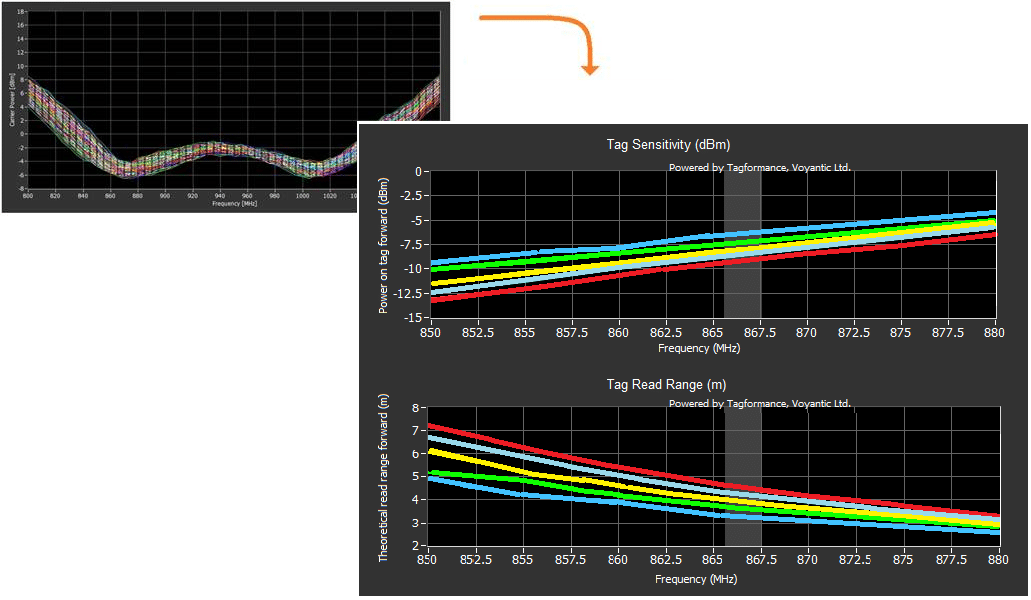
Useful RAIN RFID tag data combines production quality information with detailed laboratory test results. Production quality data is a good starting point since it shows the overall quality variation. With Voyantic’s Sweep Data Analyzer, it is easy to identify the typical and the worst acceptable tag and to quantify variation. Variation can be described, for example, as each tag having a sensitivity of -8 dBm +/-2.5 dB. With the Tagformance viewer software, the sensitivity values can also be translated into read ranges.
Step 2: Connect RAIN RFID Tag Performance Data to the Use Case
Detailed information about the performance of a RAIN RFID tag can be generated by testing the selected sample tag (typical tag or weakest tag) in a laboratory environment. The goal of the laboratory tests is to show how the tag would perform in different applications. Simply place the tag or tags on Voyantic Reference Materials in different arrangements and run the tests on Tagformance.
When proper test data is available, there is no need for extensive field tests with various tag and reader combinations. Shortening the field tests saves time and money significantly – both for the seller and the buyer.
Typical test results include RAIN RFID read ranges and orientation patterns on various materials and within diverse tag populations. When the tags are attached to different materials, their tuning, and performance level change, with the test results, it is possible to evaluate what the read range would be with varying models of readers. The results predict how the real-life RAIN RFID system will work. With proper tag data, even RAIN RFID readers can be easily compared, and the bottleneck of the system performance can be identified.
Step 3: Let the Customer Play with the Data
Utilizing RAIN RFID tag test data is really simple. As a result, you are able to assist your customer efficiently, and most likely, also to shorten tag sales cycles. If you want to learn the specifics related to RAIN RFID tag data crunching utilizing the Tagformance software, please read on.
Tagformance Read Range test results are an excellent way to compare tags. Choose test data with the tag population and material corresponding to the RAIN system use, and enter reader the information.
The graphs show the read range of one RAIN RFID tag with two different readers.
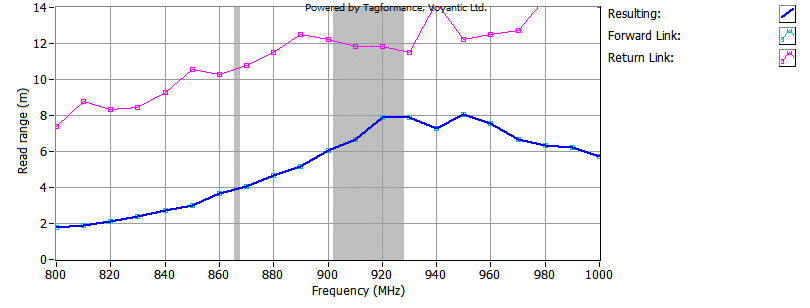
When the tag is tested with the RAIN RFID reader parameters entered into the system, the test results show the overall system performance.
In the first case, the system level read range bottleneck is tag sensitivity, and the resulting read range is 8 meters (26 feet) in the FCC frequency range.
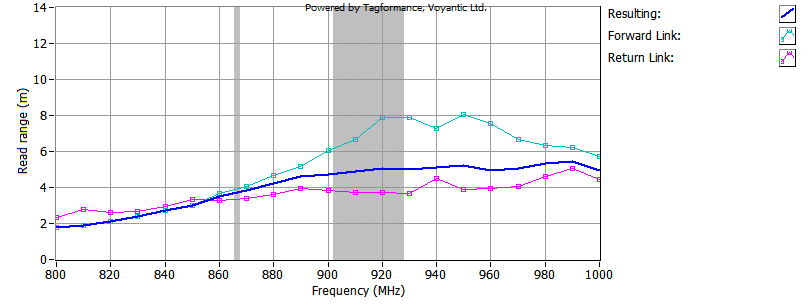
In the second scenario, the reader has lower sensitivity, read range decreases to 5 meters (16 feet), and the system level bottleneck is reader sensitivity.
It is also easy to tie production variation to the test results. With production, variation included the read range variation is 3.5 meters to 7 meters (12 feet to 23 feet).
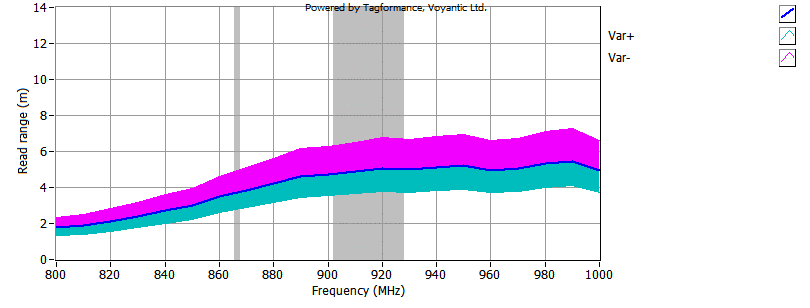
Producing the same information with tag samples and a reader is difficult and uncertain. Depending on the selected sample tag, the expected read range may be anything between 12 feet and 23 feet, and there is no information about the variation. Surprises await in implementation, and counting accuracy is likely to be well below 100%.
Other test results show, for example, the orientation pattern – how the read range changes when the tag and the reader are not facing each other directly, and how the tag performance changes when there are multiple tags in front of the reader.
Good RAIN RFID Tag Performance Data is a Powerful Sales Tool
There is a lot of tag test data available, and the Tagformance viewer software is an excellent tool for presenting the data to the customers.
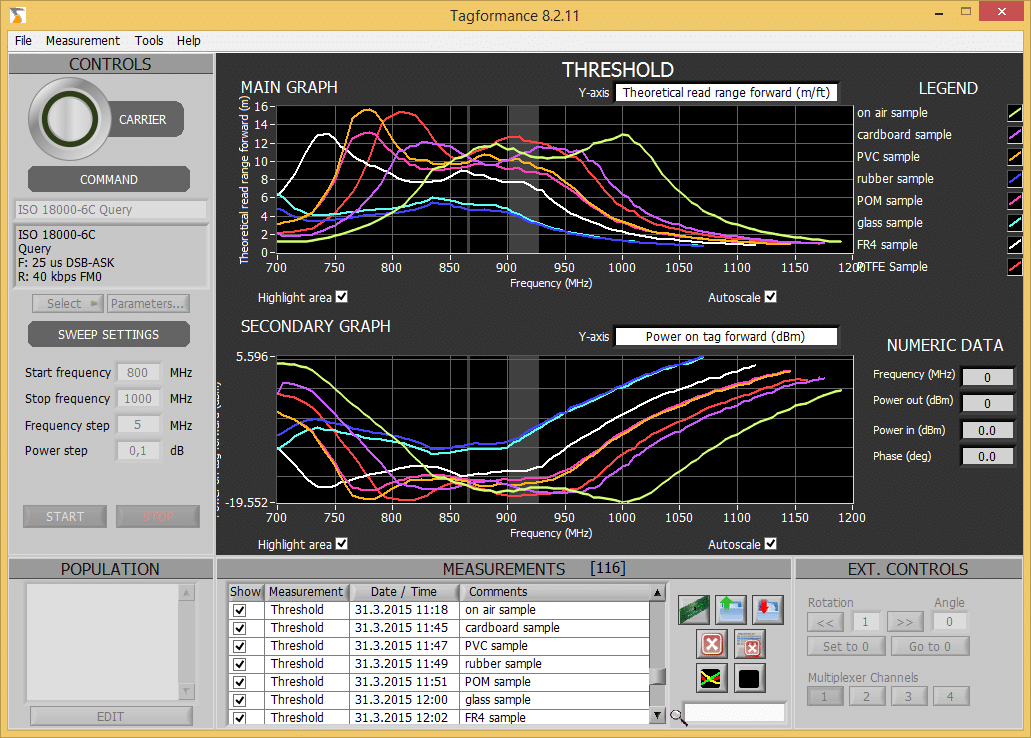
Tagformance Viewer is Available and Can Be Used by Anyone
With the viewer software, it is easy to choose results from RAIN RFID tag tests corresponding with the customer’s intended use scenario, input reader information, and see the actual system-level performance.
Download a Sample Datasheet Showing RAIN RFID Tag Performance and Quality Information
Download here an excerpt from a sample datasheet showing how to tag data could be presented in a datasheet. The sample shows how the tag performance and quality information is presented in a format that is useful for the customer in tag selection.
Download Sample Test Data and Tagformance Viewer Software
The Tagformance viewer software can be used to view test data. By inputting different reader parameters, such as reader power, to the software, the application shows how the read range changes. By inputting tag variation information, read range variation can be seen. The viewer software can be used for viewing and analyzing data from the tag developers and manufacturers. Would you like to try? Contact us and I will be happy to send you the software installer with demo results!