All blog posts

Analysis of the Cost of RFID Quality – And How (Not) to Lose a Customer

May 03, 2021

We hosted a webinar on managing quality in RAIN RFID and NFC manufacturing. During the session, industry experts shared their views on setting quality goals, on the relevant standards, and on best practices for quality testing through case examples and practical tips. While veterans in RFID quality testing recognize the need for it to achieve excellent and consistent quality, for many less experienced in the field, it can be puzzling to justify the investment for the required RFID test equipment.

With this in mind, it is worthwhile to explore whether the cost of good quality in the context of RFID is justifiable. In an earlier blog post, we discussed optimizing the cost of quality. In this post, we give an example analysis of RFID quality costs.

Analysis of the Cost of RFID Quality

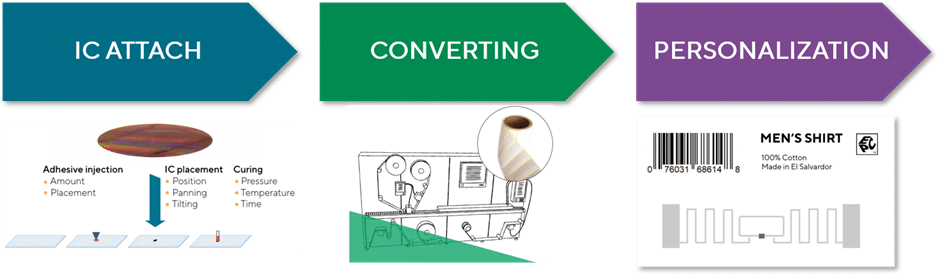
Typically, the three main process steps in smart label manufacturing are chip attach, converting, and personalization. While the process details are specific to the manufacturer and machine, the analysis methods are universal:

  • Failure analysis: What is the impact of possible machine failures?
  • Process analysis: How do quality defects impact the process?
  • Cost analysis: What is the cost of quality defects?
Three main processes in smart label manufacturing

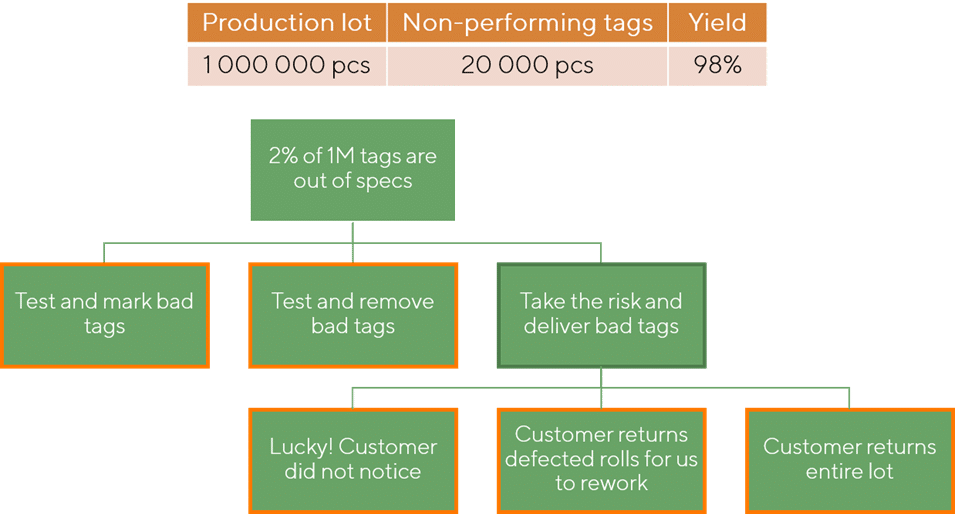
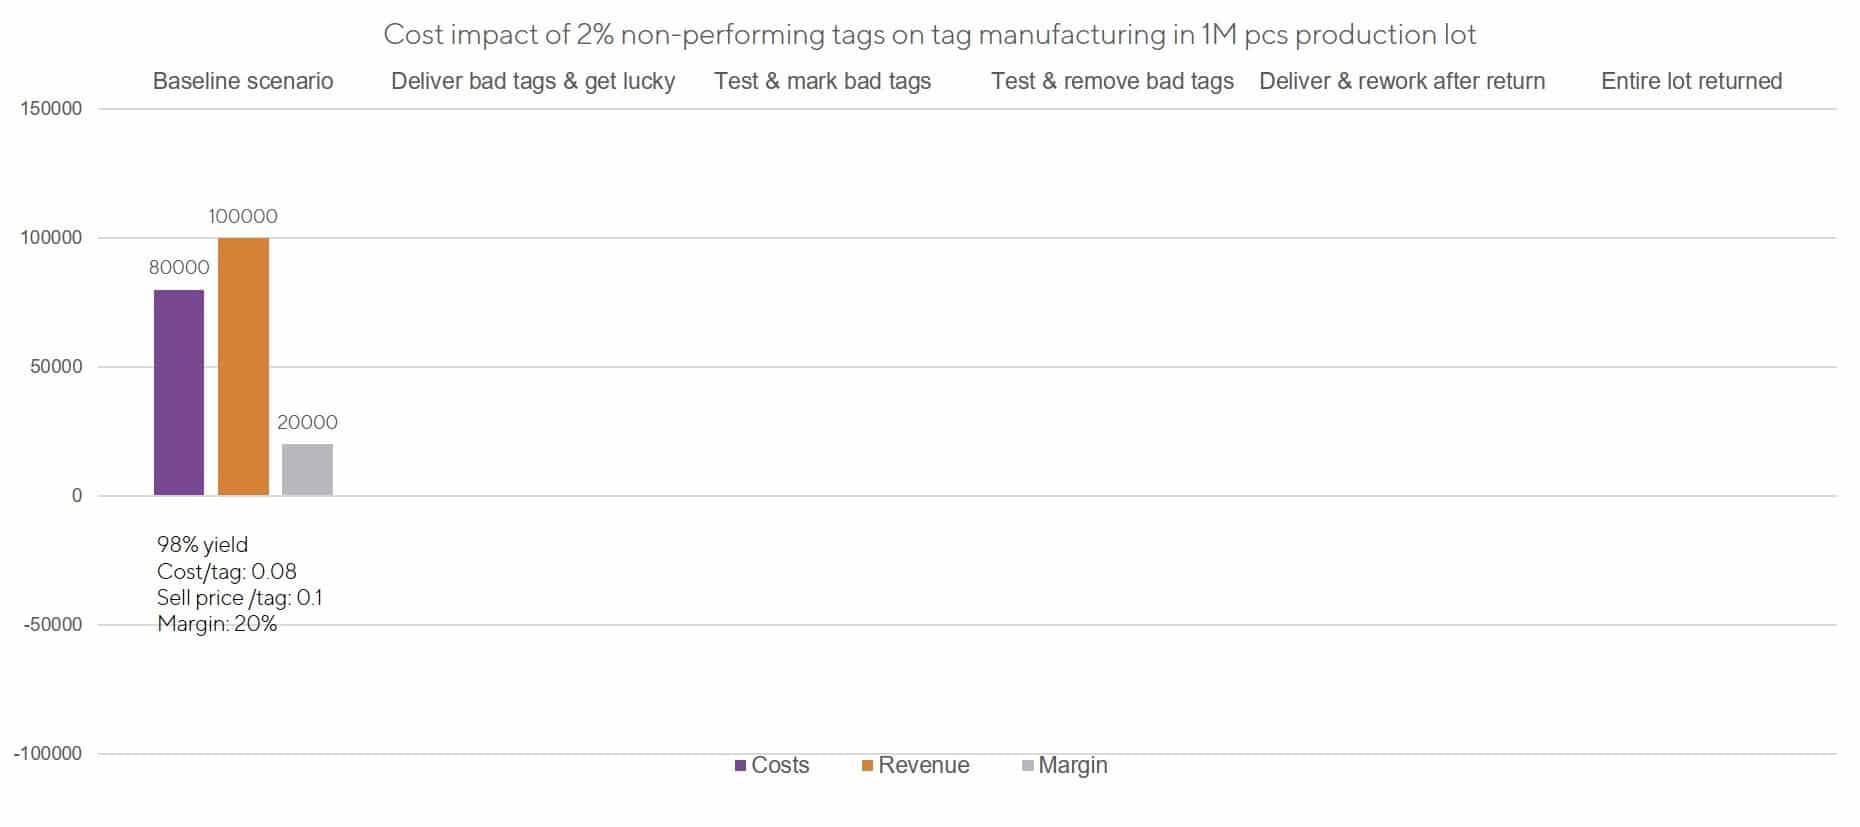
To remain in scope, our example analysis focuses on the cost impact of non-performing RFID tags in production. The case analysis is inspired by the case study presented by our customer Lab ID in our previous webinar session. In our modified case example, we are tasked with the delivery of 1 million labels to a customer. Let us assume that our manufacturing process has a yield of 98%. Out of the 1 million produced tags, 2% would be non-performing, meaning that these tags are bad quality or out of specification. Confronted with this reality, there are three possible actions to address non-performing tags which are described in the picture below.

Different scenarios that can play out based on the action taken to address quality testing and deal with bad tags

The first one is the baseline scenario for the case. We assume that cost and sell price per tag are 0.08 and 0.1, respectively. This leaves us with a margin of 20% for this production lot. In this scenario, we do not take into account any potential cost impact of 2% non-performing tags.

Base scenario – 2% of tags are non-performing

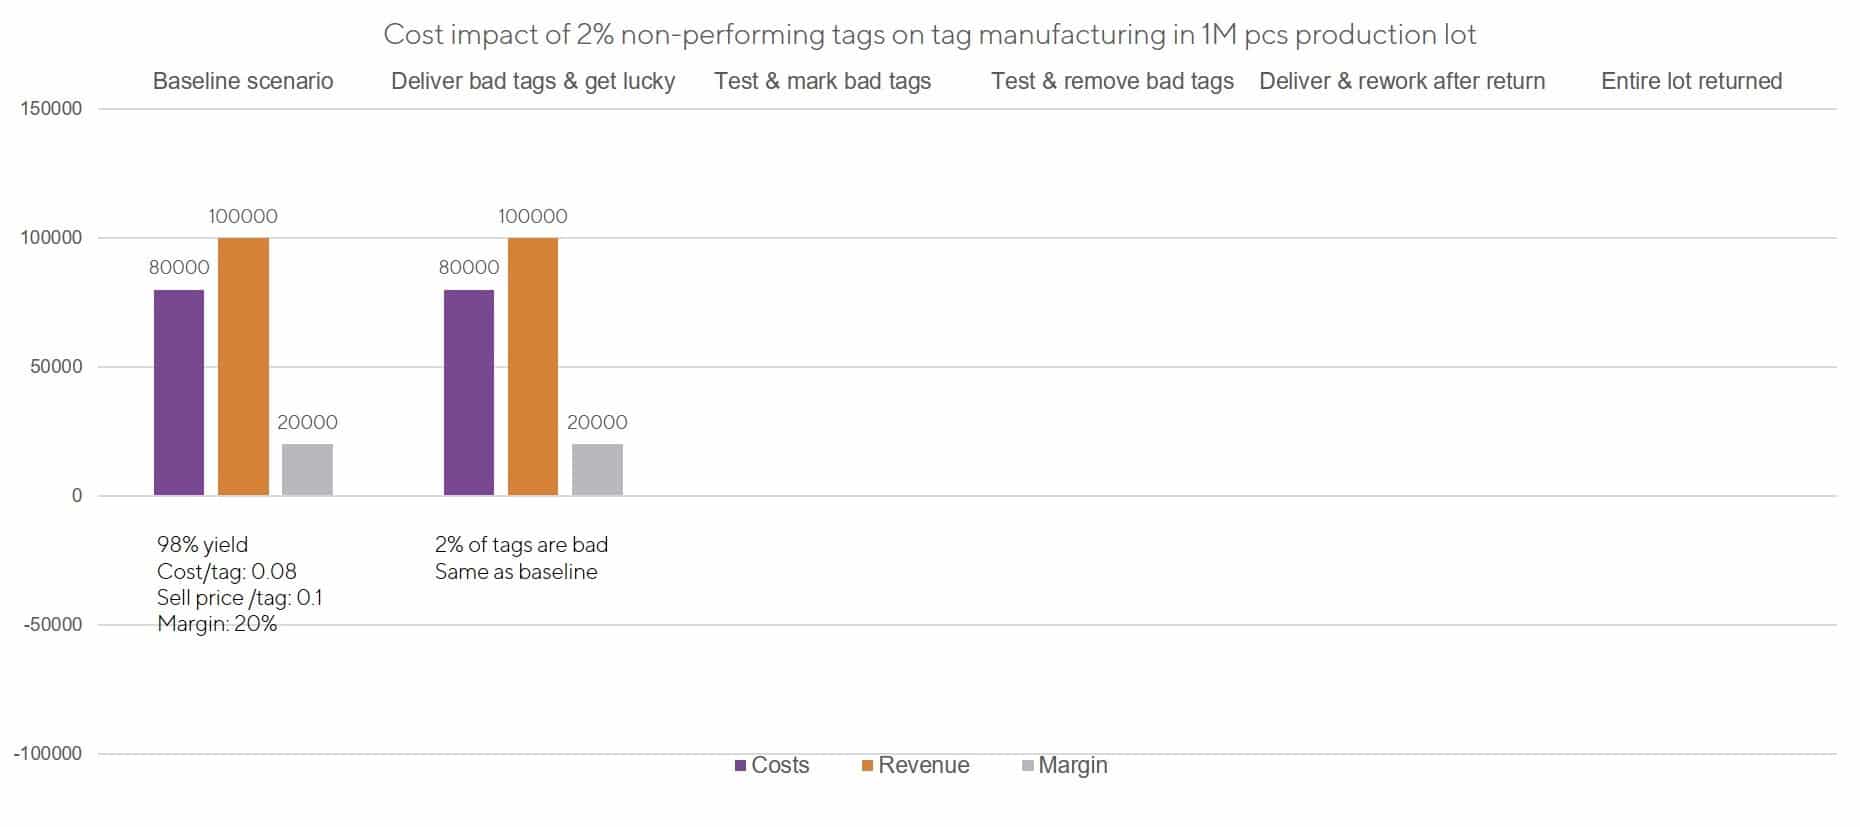
In the next scenario, we ride our luck and deliver all tags without addressing the bad ones. Thankfully, the customer does not notice any defects this time. While the 2% of non-performing tags did not have any repercussions on our margins, the last two scenarios showcase how repeating the action might bite us back the next time. We also do not consider the implications of how the bad tags will inevitably affect our customer’s business.

We get lucky – customer does not notice delivered bad tags

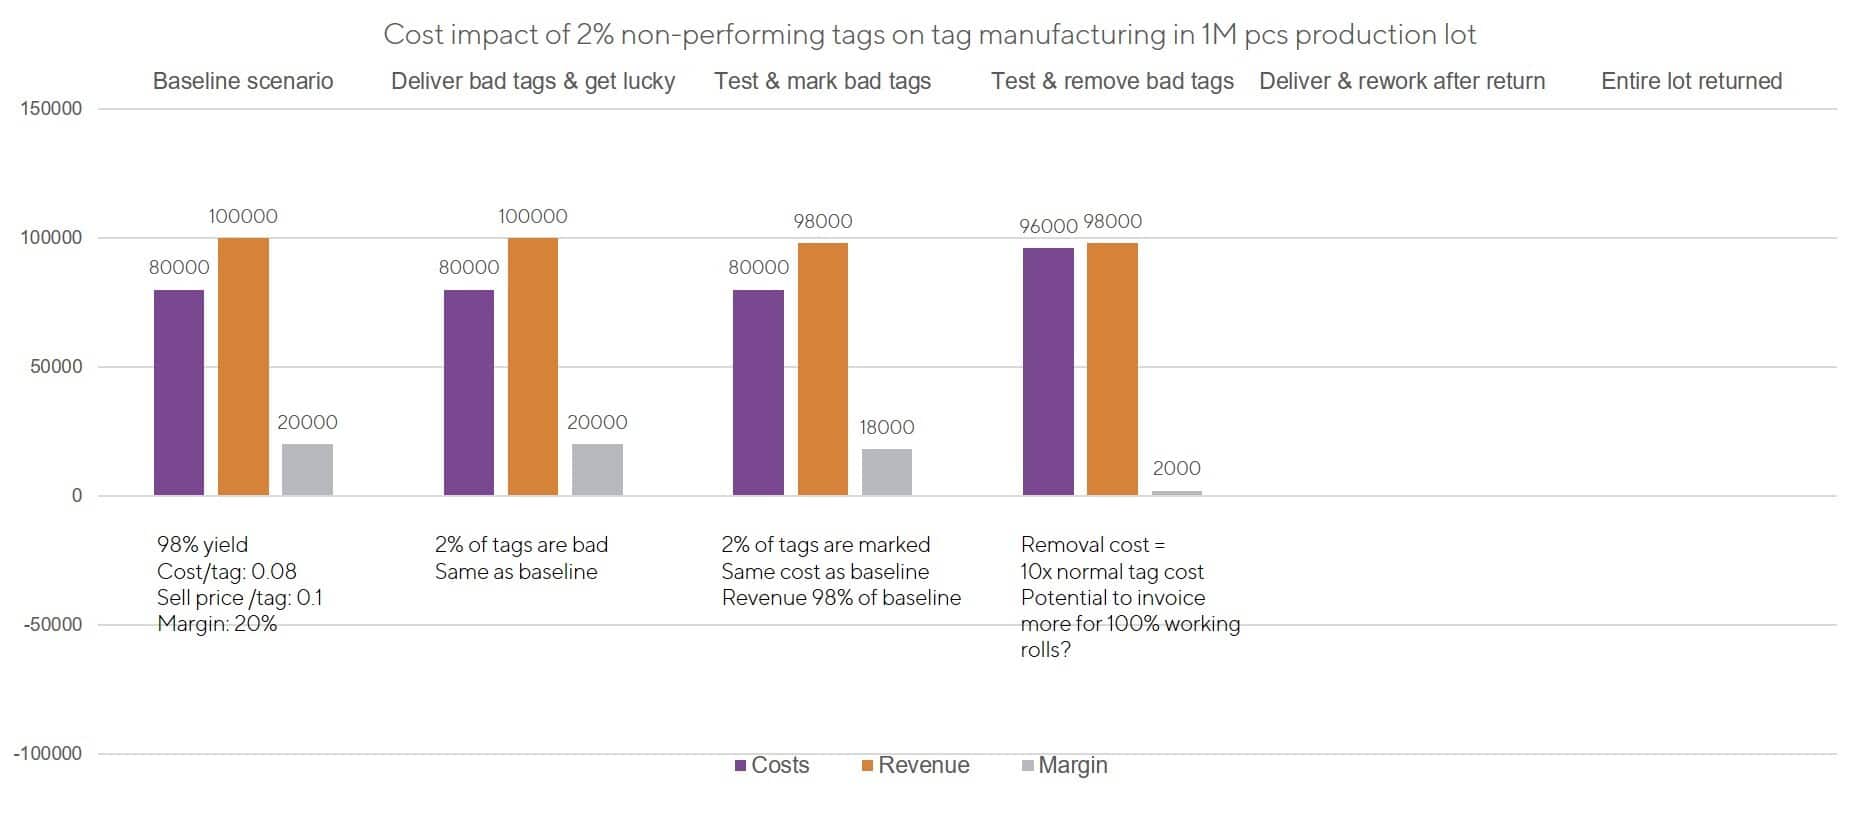
We can also do something about the bad tags. In the third scenario, we decide to test our tags and mark the bad ones during production. This would incur costs in the form of initial tester investment (a capital expenditure that is omitted from the costs of this single production lot) and marker ink (a largely negligible running cost). Marking the tags does not introduce extra production processes or require an operator to supervise the machine. With the help of the tester, we are able to mark the non-performing tags out of the 1 million. This sees our margins decrease slightly (20% to 18%) as we do not charge the customer for the bad tags.

Alternatively, we can also decide to test and then remove bad tags during production. Aside from the initial equipment investment as with the previous scenario, this also requires additional steps in the production, e.g. by handling non-performing tags with a splicing table and changing them to a normal one. This process also requires an operator overseeing the production process which induces additional costs. For our analysis, we assume this removal of a bad tag is ten times the normal cost of producing a tag. This would add a somewhat significant cost to us but our margins remain positive at 2%. Worth considering in this scenario is customers’ willingness to pay more for rolls with 100% working tags. This could help offset the extra costs associated with tag removal.

Testing tags – in both scenarios we can achieve a positive margin

Next, we deliver all tags, 98% good and 2% bad. This time neglecting quality has consequences: the customer notices defects in our delivery, returns the lot, and demands we rework them to reach the promised quality. This requires us to find the non-performing tags from the lot and replace them with good-quality ones. For our analysis, we assume all that tag replacement hassle along with the changes to production planning costs us 25 times the normal cost of producing a tag. Not only have our margins turned negative, but we also need to deal with an annoyed customer whose plans have been disrupted.

Final two scenarios – not testing tags can have grave financial and reputational consequences

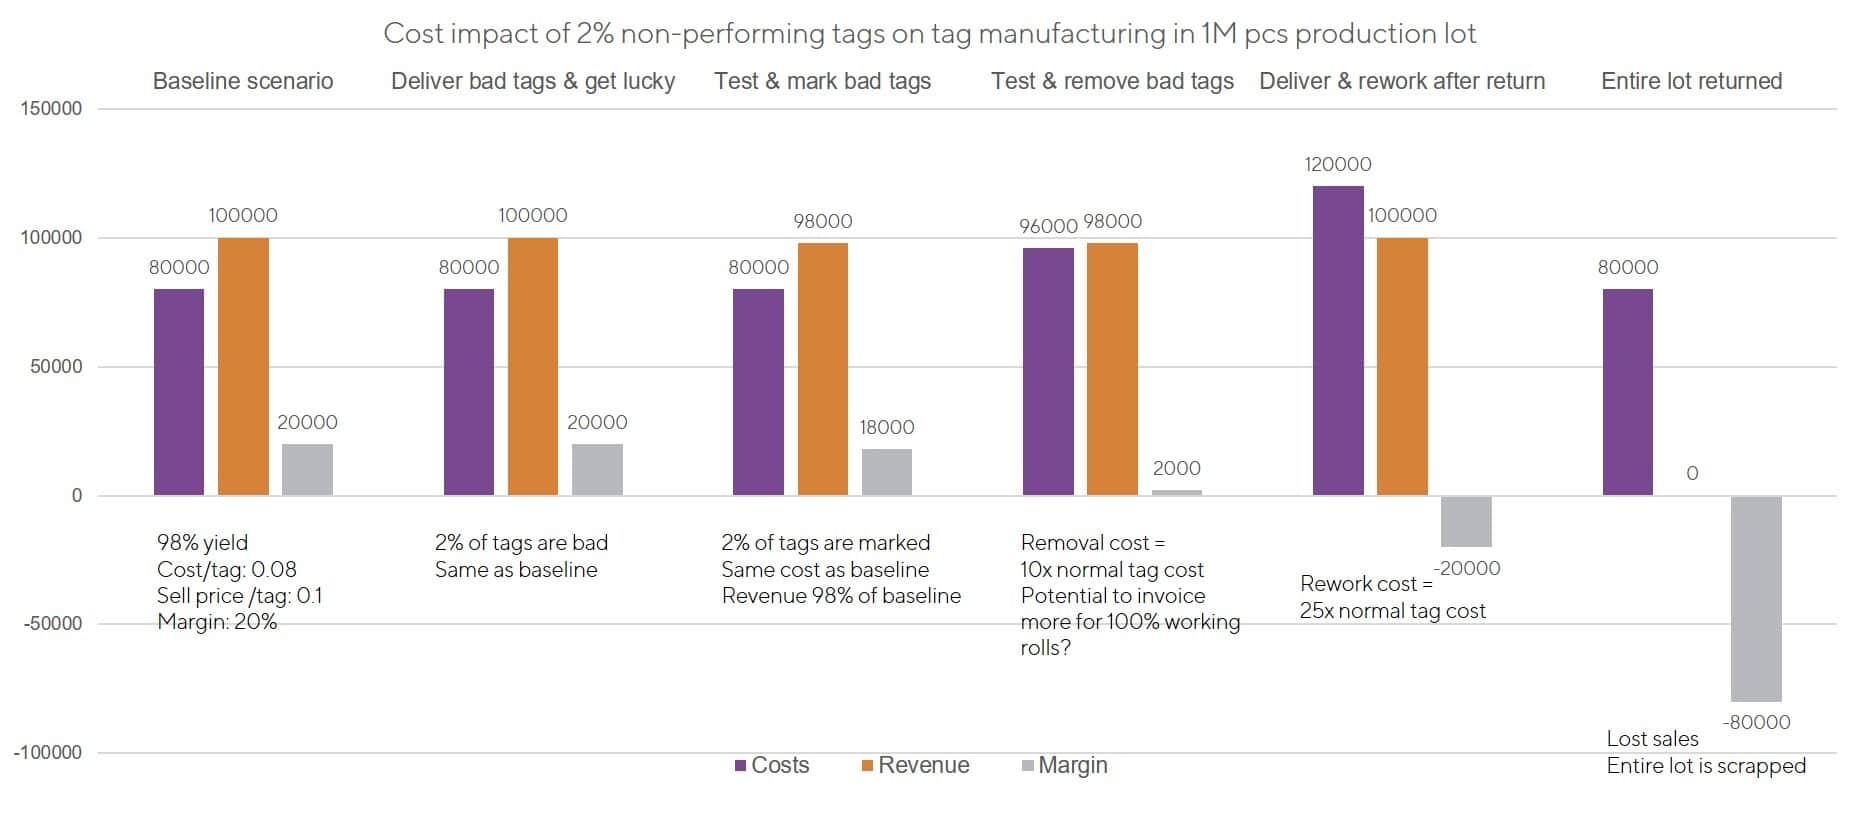
In the final “doomsday” scenario, after delivering the production lot, the customer detects the defects, simply returns the lot, and stops doing business with us. Revenue for this production lot has been lost, our customer relationship is severely damaged and our reputation as a tag manufacturer is also at risk. Not addressing quality issues and providing no quantifying proof of quality can have severe consequences. As shown, a single batch of tags mixed some with inferior quality can do much more harm than expected.

Loss of customer relationships is difficult to measure in costs

Being able to quantify quality puts tag producers in a superior position to win and establish trust with customers. Getting there requires effort but as shown in our example it is a worthwhile pursuit in the long run. We are happy to help with your needs in getting there. A good resource to start with is our webinar on managing quality in RAIN RFID and NFC manufacturing.

On-Demand Webinar

Quality Management Approaches in RAIN RFID and NFC Manufacturing

All blog posts
All blog posts

Downgrading Your Spec Does Not Make a Quality Tag – Thoughts About RFID Quality

Jul 08, 2016

中文版 Chinese version

I work as the CEO of Voyantic, a company that specializes in RFID test and measurement equipment. Since our systems are used by hundreds of companies around the world, we often come across cases where a customer needs our help to verify that their tags work as they should. This is a story about a case where things went wrong.

Tagging Athletes in Cross-country Skiing

We got involved with a very interesting case a couple of years ago. A small RFID integrator that we have known for some time wanted to tag athletes in a cross-country skiing competition. The idea was to use RFID for timing the race. And you can guess that if someone spends several hours on the ski track, being left without a race time is definitely not an option.

Cross-country skiing is a healthy hobby and also a good application for RFID timing – Photo by Sorbis / Shutterstock.com

There are many different ways to tag athletes in timing solutions. Common approaches in running competitions include integrating the RFID tags to the race bibs or attaching them to the shoes of the runners. However, in this case, the chosen approach was to buy wrist-band tags and to attach them to the ankles of the skiers. The tags were read by fixed readers that were set up on the side of the tracks.

The integrator went through the specifications of several different wrist-band tags and finally contacted a fairly well known maker of specialty tags for some samples. The samples arrived the following week, and the integrator ran some field tests. Everything worked well. He was able to detect every skier that passed the reader antenna.

So the integrator decided to order the tags that he needed for his application. Once again, there was a timely delivery of correct amount of tags. However, when he started to build the application, he noticed that not all of the tags were working. A typical discussion between an unsatisfied customer and a worried supplier followed.

The conclusion was that all the supplied tags worked according to the specification.

The tag manufacturer tested both working and non-working tags attached to the wrist of whoever they considered to be their standard-human. All tags were readable from a distance of 2 m which was the specification. But they didn’t all work in the end application. How is this possible?

Analysis

We got involved with the case at this point. We were asked to take a look at the tag samples to try to understand what was going on. So we ran a performance test for the tags using the Tagformance measurement system. The results from the Threshold Sweep measurement are shown below.

Performance variations of wrist-band UHF RFID tags measured with the Tagformance system

We tested the tags in free air, so they were not attached to a wrist or an ankle. But even in this setup it is clearly visible that there are significant variations in the tuning and performance of the tags. So this is what we think happened:

  1. The integrator decided to use the tags differently from what the manufacturer had specified
  2. The first samples sent by the tag manufacturer performed clearly above the spec
  3. The integrator concluded that this tag will work in the application
  4. The next tag batch – even though still within the original spec – performed differently
  5. A part of the tags didn’t work.

So, it is very hard to point fingers in this case. But there is something that the RFID industry needs to improve in. The industry is already doing a decent job in reporting the performance of their tags, e.g. in expected read range. But I think there is a lot to improve in how performance variations are reported, because that is a key factor in building reliable RFID systems.

And what happened with the skiing competition? Did the integrator get the system to work? He did. But he had to manually test through the tags and hand-pick the ones that worked well enough. Hardly a perfect outcome but every skier got their time.

My company Voyantic specializes in test and measurement solutions for the RFID industry. Are you interested to learn more about RFID quality control? Download our sample quality test report and contact us.

White Paper: How to Minimize Quality Variation in RAIN RFID and NFC Smart Label Manufacturing

Learn the practical effects of quality variation and how to minimize it.

All blog posts
All blog posts

How to Win Sales with Good RAIN RFID Test Data

Dec 29, 2015

When selling RAIN RFID tags: wouldn’t it be great to prove that the proposed tag is the best possible one for the customer’s application instead of just sending out loads of free samples hoping that the customer tests them properly? And when purchasing: wouldn’t it be great to have comparable data of how each tag works in your application instead of “our tags are the best ones, you can trust us” statements?

Guess what: it is possible, and in most cases, the salesperson or the buyer just needs to know what to ask. Tag developers have a lot of characterization data ready. Read on to see how to leverage that data following the 3-step approach!

Step 1: Extract Tag Characterization Data from the Production Quality Log

Useful RAIN RFID tag data combines production quality information with detailed laboratory test results. Production quality data is a good starting point since it shows the overall quality variation. With Voyantic’s Sweep Data Analyzer, it is easy to identify the typical and the worst acceptable tag and to quantify variation. Variation can be described, for example, as each tag having a sensitivity of -8 dBm +/-2.5 dB. With the Tagformance viewer software, the sensitivity values can also be translated into read ranges.

RAIN RFID tag quality – variance in RFID production quality

Step 2: Connect RAIN RFID Tag Performance Data to the Use Case

Detailed information about the performance of a RAIN RFID tag can be generated by testing the selected sample tag (typical tag or weakest tag) in a laboratory environment. The goal of the laboratory tests is to show how the tag would perform in different applications. Simply place the tag or tags on Voyantic Reference Materials in different arrangements and run the tests on Tagformance.

When proper test data is available, there is no need for extensive field tests with various tag and reader combinations. Shortening the field tests saves time and money significantly – both for the seller and the buyer.

Typical test results include RAIN RFID read ranges and orientation patterns on various materials and within diverse tag populations. When the tags are attached to different materials, their tuning, and performance level change, with the test results, it is possible to evaluate what the read range would be with varying models of readers. The results predict how the real-life RAIN RFID system will work. With proper tag data, even RAIN RFID readers can be easily compared, and the bottleneck of the system performance can be identified.

Step 3: Let the Customer Play with the Data

Utilizing RAIN RFID tag test data is really simple. As a result, you are able to assist your customer efficiently, and most likely, also to shorten tag sales cycles. If you want to learn the specifics related to RAIN RFID tag data crunching utilizing the Tagformance software, please read on.

Tagformance Read Range test results are an excellent way to compare tags. Choose test data with the tag population and material corresponding to the RAIN system use, and enter reader the information.

The graphs show the read range of one RAIN RFID tag with two different readers.

RAIN RFID tag read range

When the tag is tested with the RAIN RFID reader parameters entered into the system, the test results show the overall system performance.

In the first case, the system level read range bottleneck is tag sensitivity, and the resulting read range is 8 meters (26 feet) in the FCC frequency range.

RAIN RFID tag read range and reader sensitivity

In the second scenario, the reader has lower sensitivity, read range decreases to 5 meters (16 feet), and the system level bottleneck is reader sensitivity.

It is also easy to tie production variation to the test results. With production, variation included the read range variation is 3.5 meters to 7 meters (12 feet to 23 feet).

RAIN RFID tag read range and production variation

Producing the same information with tag samples and a reader is difficult and uncertain. Depending on the selected sample tag, the expected read range may be anything between 12 feet and 23 feet, and there is no information about the variation. Surprises await in implementation, and counting accuracy is likely to be well below 100%.

Other test results show, for example, the orientation pattern – how the read range changes when the tag and the reader are not facing each other directly, and how the tag performance changes when there are multiple tags in front of the reader.

Good RAIN RFID Tag Performance Data is a Powerful Sales Tool

There is a lot of tag test data available, and the Tagformance viewer software is an excellent tool for presenting the data to the customers.

Tagformance viewer software

Tagformance Viewer is Available and Can Be Used by Anyone

With the viewer software, it is easy to choose results from RAIN RFID tag tests corresponding with the customer’s intended use scenario, input reader information, and see the actual system-level performance.

Download a Sample Datasheet Showing RAIN RFID Tag Performance and Quality Information

Download here an excerpt from a sample datasheet showing how to tag data could be presented in a datasheet. The sample shows how the tag performance and quality information is presented in a format that is useful for the customer in tag selection.

Download Sample Test Data and Tagformance Viewer Software

The Tagformance viewer software can be used to view test data. By inputting different reader parameters, such as reader power, to the software, the application shows how the read range changes. By inputting tag variation information, read range variation can be seen. The viewer software can be used for viewing and analyzing data from the tag developers and manufacturers. Would you like to try? Contact us and I will be happy to send you the software installer with demo results!

All blog posts