All blog posts

Managing RAIN RFID Production Quality

Nov 03, 2017

中文版 Chinese version

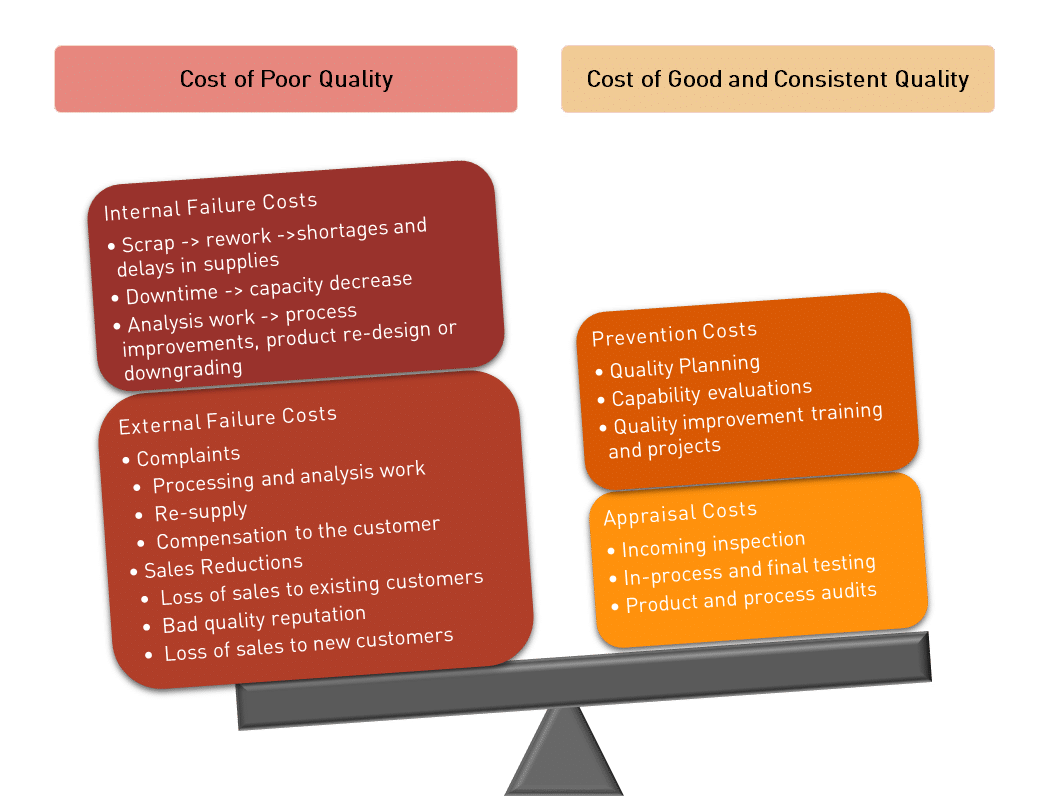
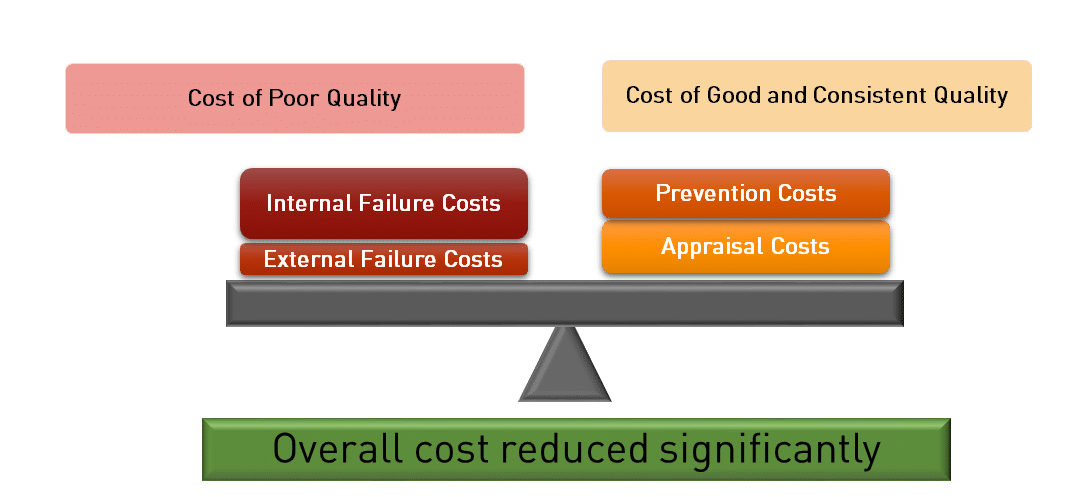
RAIN RFID use has grown rapidly and implementations are expanding. Nowadays RFID is business as usual and quality management is an essential part of normal business operations. In past few years the RFID industry has learned a lot about quality management methods and processes. In my opinion there is still room for improvement. Quality really matters in RAIN tag manufacturing as high readability of tags is expected practically in all applications. In this text I describe how some quality management principles relate to tag manufacturing.

Continual Improvement in RFID Tag Manufacturing


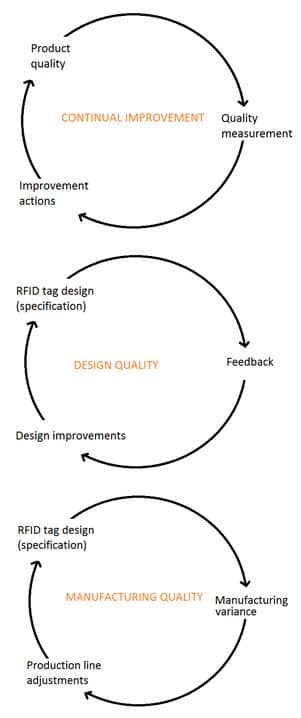
One of the key principles in ISO 9000 quality standard series is continual improvement and accordingly

  • quality must be measured;
  • results need to be analyzed; and
  • operations will be improved.

There are two ways to look at the quality:

1 – Quality of design is measured against the properties (e.g. features, functionalities, performance) the supplier intends to deliver to the customer. Improvements can be driven for example by new kind of customer requirements, changes in competing products and availability of new components.

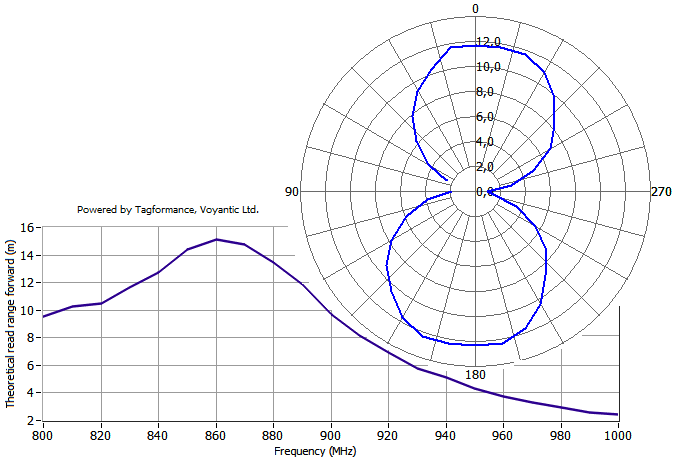
Typical performance measures for RAIN tags are sensitivity/read range and orientation pattern, performance on different materials (tagged items) and in proximity of other tags. Additionally, for example memory options, command support, mechanical design and dimensions and durability are ingredients of design quality.

Improving Quality of design is responsibility of the R&D and usually requires new product development, e.g. modifying the antenna geometry. Improvement cycles are relatively long.

2 – Quality of manufacturing describes how much variation there is in performance of the key properties compared to the defined design quality.

In RAIN tags the typical measure of quality is sensitivity. For example: Sensitivity of the tag attached to PVC plastic, with 915MHz frequency is -20dBm +/- 0.5dB. In this example the -20dBm is design quality and +/-0.5dB is variation describing manufacturing quality.

In managing Quality of manufacturing the performance is measured by the quality organization and corrective actions can be implemented very quickly.

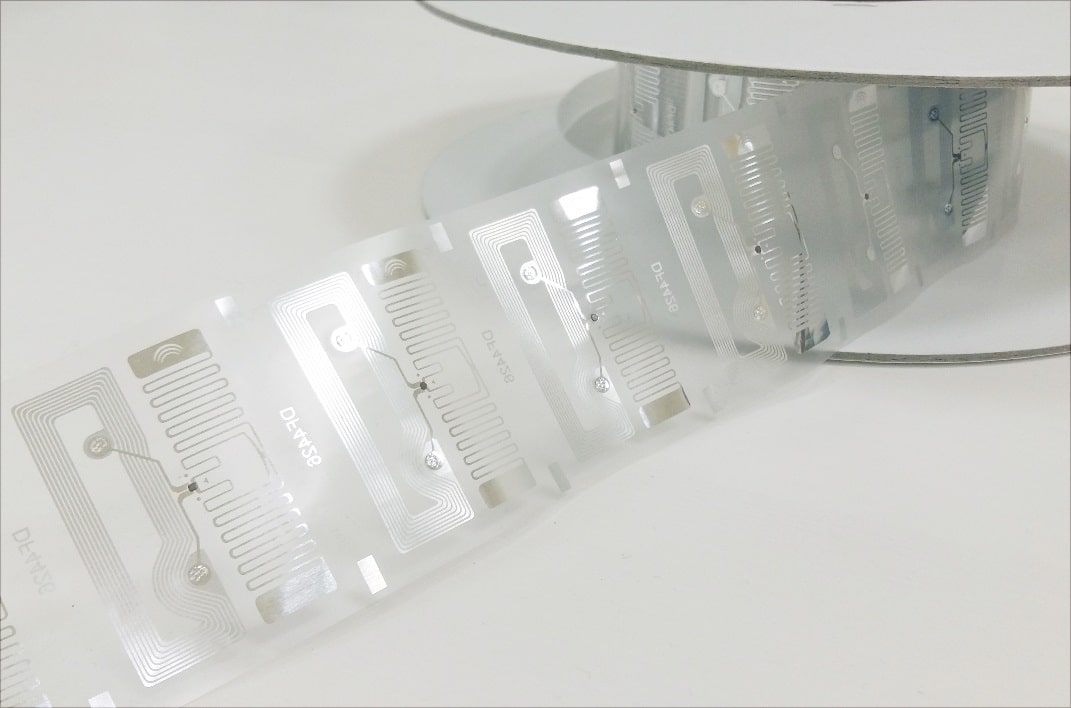
The basic methods for controlling quality in tag manufacturing are sample testing and continuous in-line testing.

RAIN Tag Manufacturing Quality Control

One single solution doesn’t fit all RAIN tag manufacturing processes, but the principles of applying either sample testing using an off-line tester or implementing the tester into the production machines to enable 100% in-line testing are universal.

Sample Based Testing

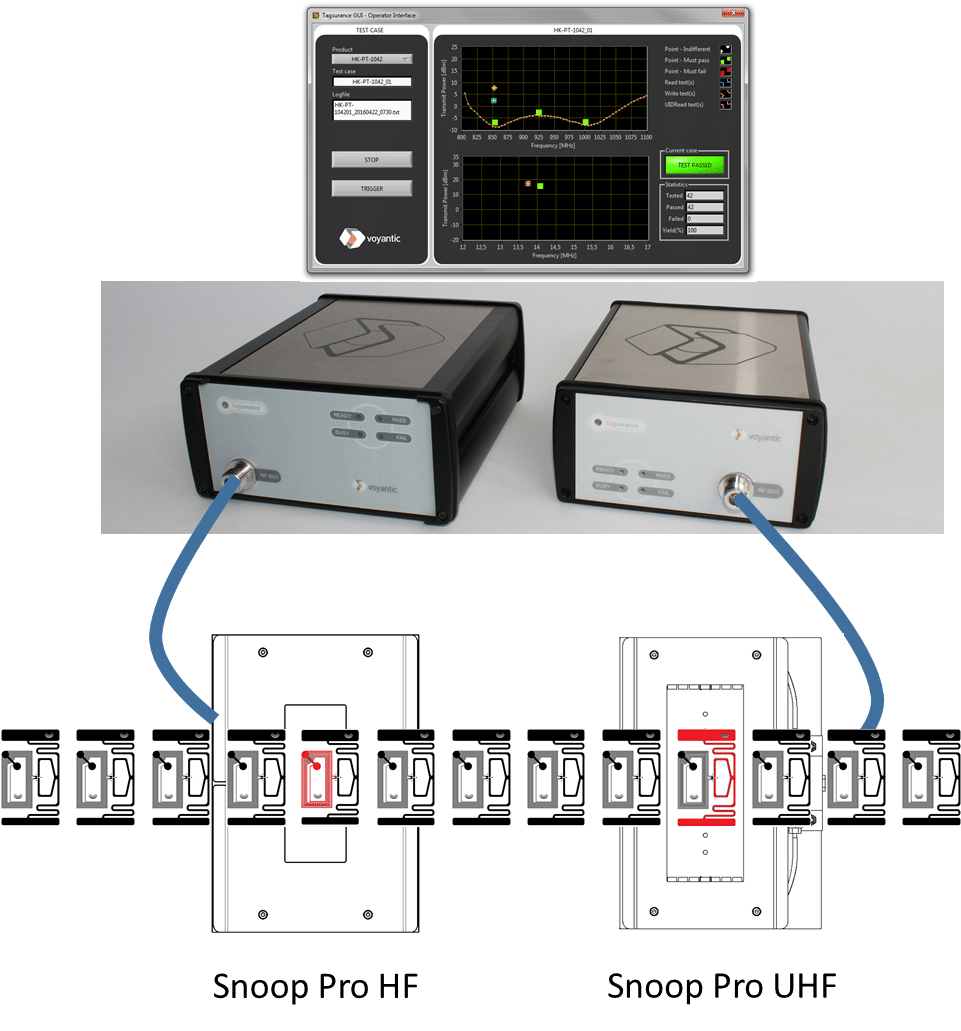
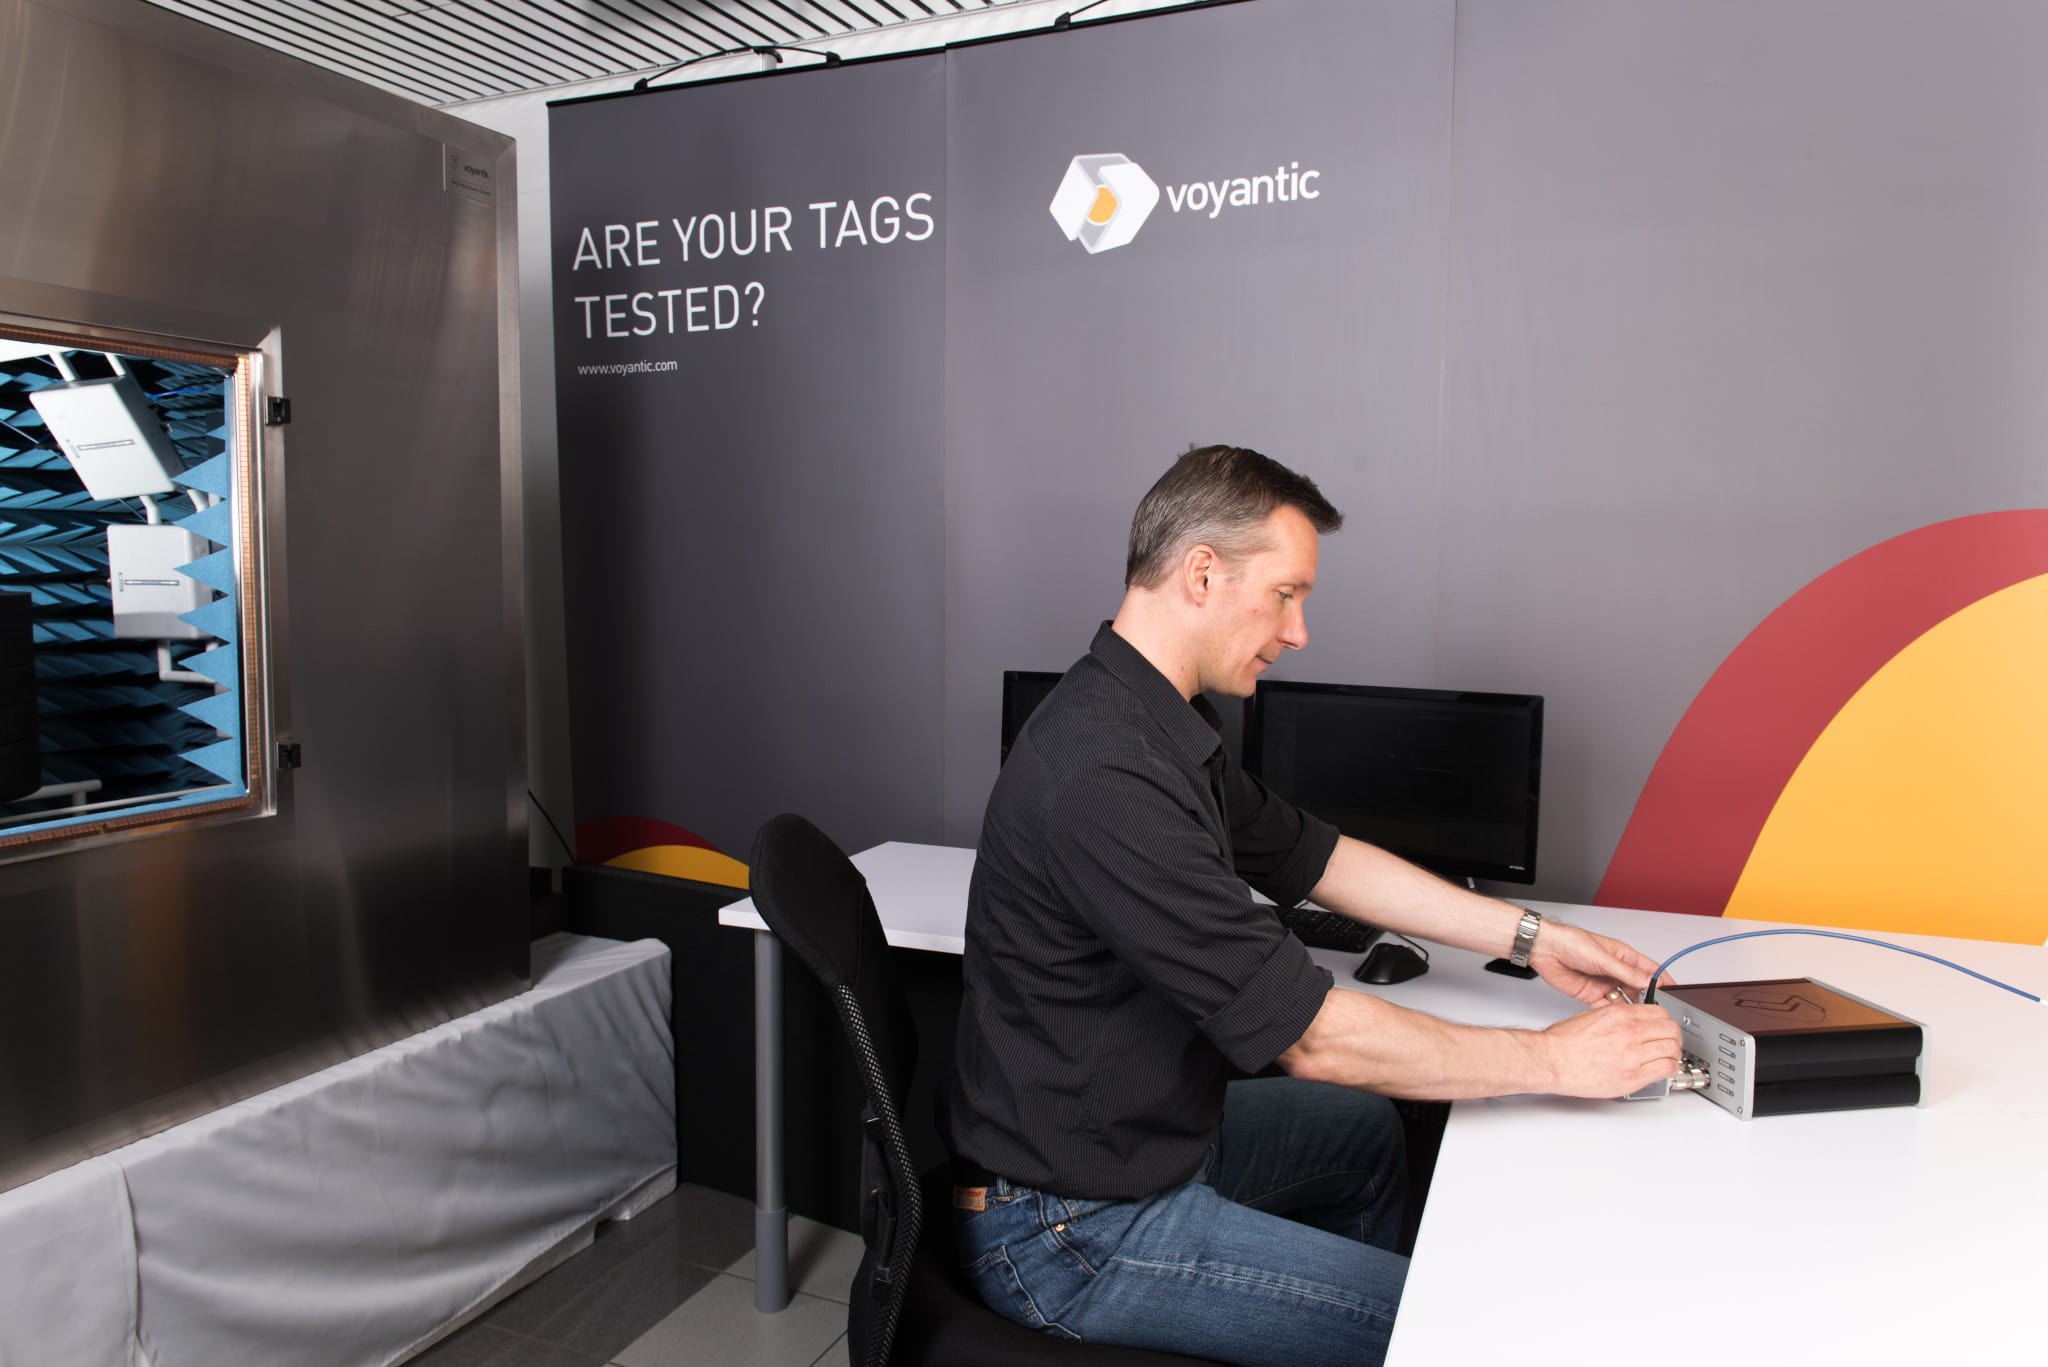
For example, with 100,000 tags daily production, 99% confidence level with 2% margin of error requires about 4,000 tags to be tested. In practice, 1-2 tested tag rolls per day per manufacturing line would be the statistically valid sample size. Voyantic Reelsurance handles the testing automatically after the testing is initialized. Several rolls per day can be tested with one machine, and the system produces full quality logs. Reelsurance is an example of an off-line reel-to-reel tester capable of testing RAIN tags either in inlay or label form. The testing capability is based on integrated Tagsurance tester.

100% Testing and Quality Log

Voyantic Tagsurance tester can also be integrated with various manufacturers’ chip attach, converting or personalization machines enabling 100% testing.

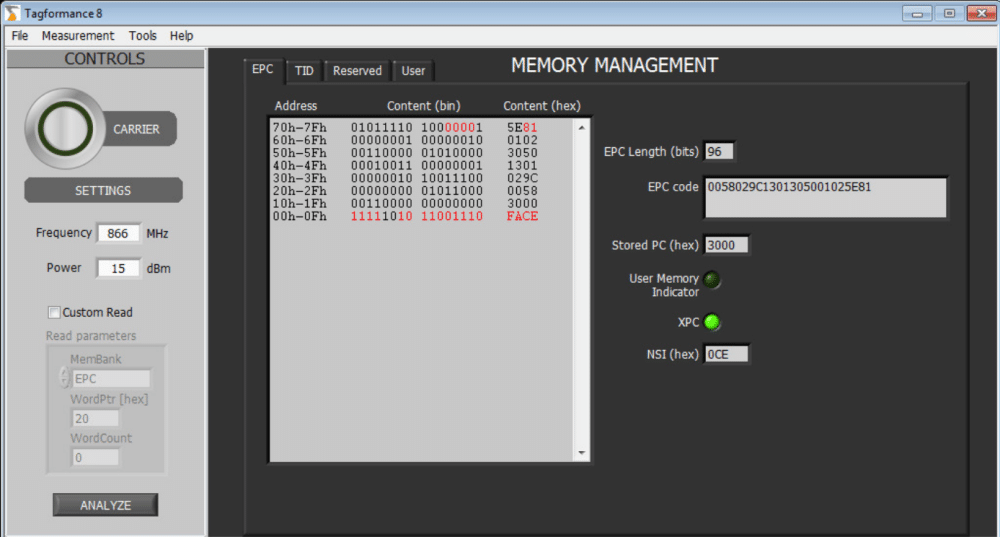
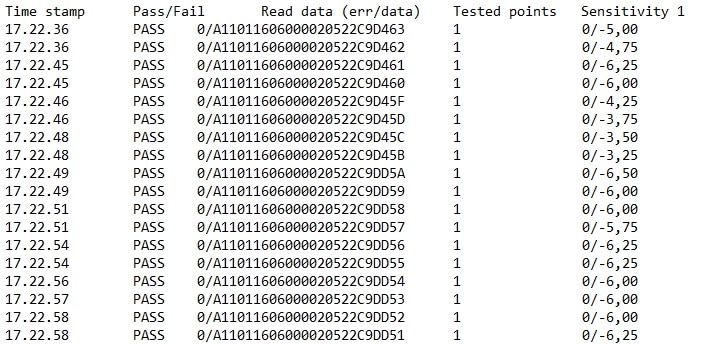
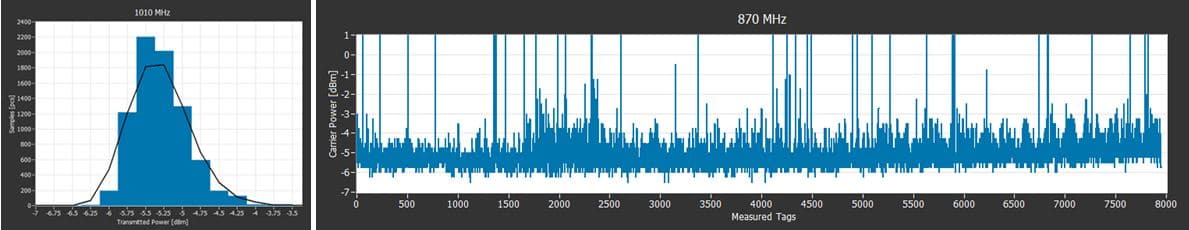
The testing creates a log file that can include TID and EPC codes of the tested tags, as well as test results. This is a handy tool for communicating 100% test results. The data can be used for finding out statistical information from the manufacturing quality: variation, standard deviation, percentiles, mean values.

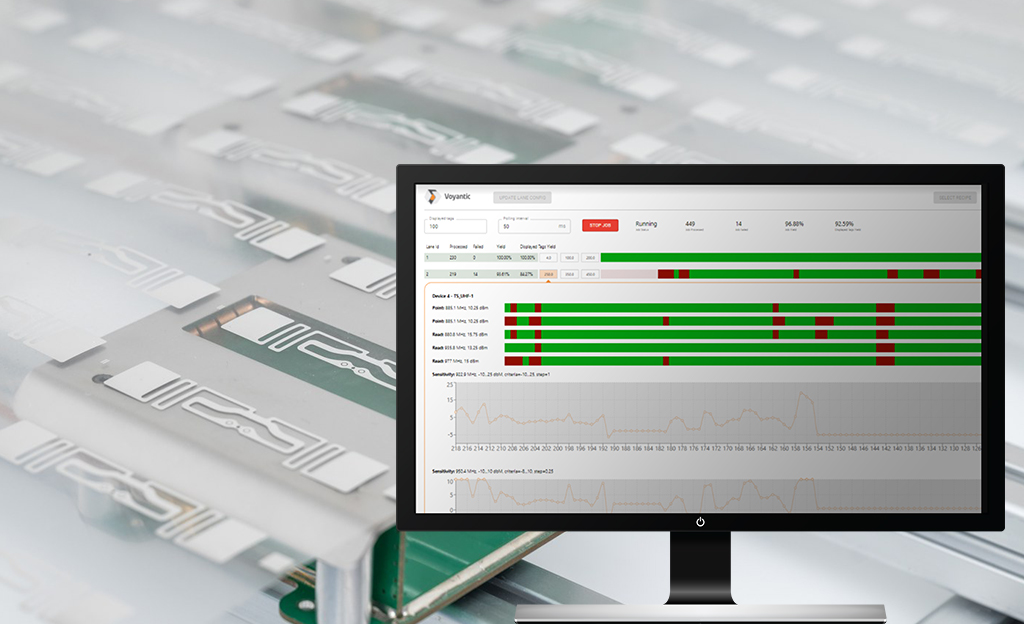
Real-time Visibility to Production Quality

When information is available for the production line operator real time, it is easy to see when quality starts to deviate, and corrective actions can be taken immediately, without sacrificing production yield.

RFID Tag Manufacturing and Six Sigma

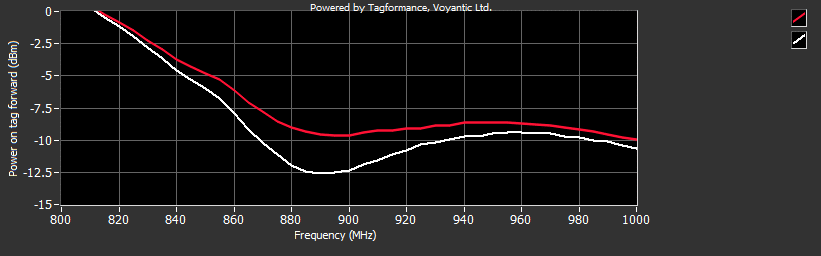
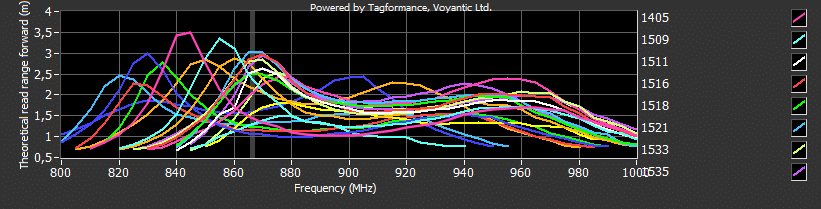
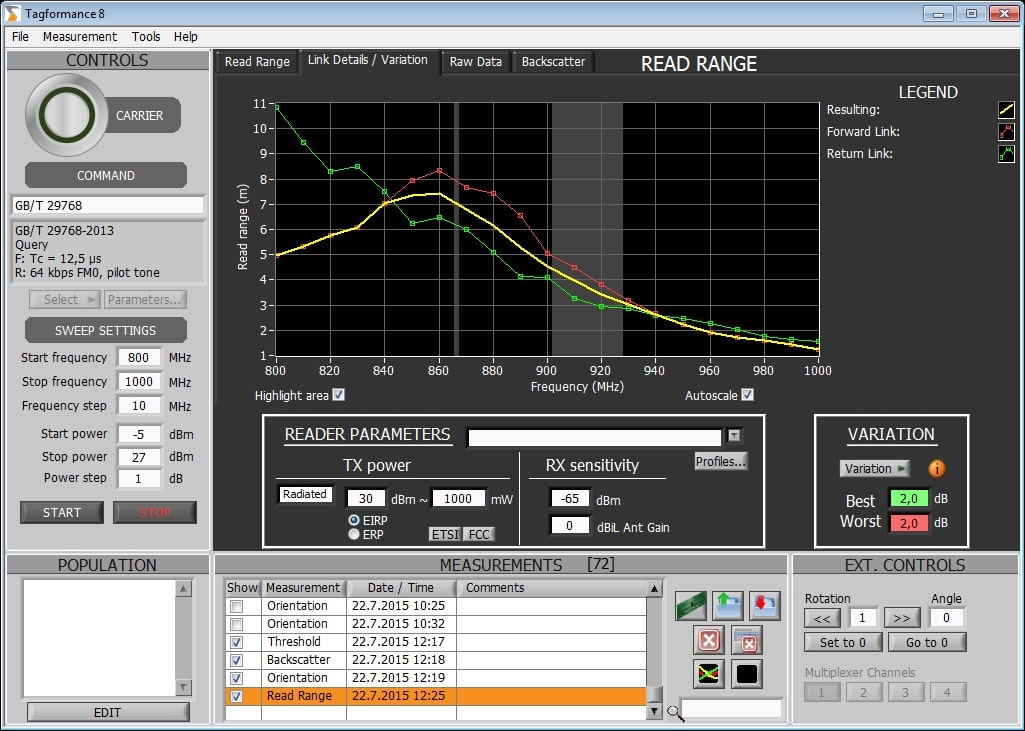
A typical output from a tag manufacturing process used to be skewed normal distribution with additional second peak as shown in the picture across wide frequency band: the “stray” tags made it impossible to implement Six Sigma to the letter. Instead, deviating tags can be sorted out, and Six Sigma limits may be used for the remaining part.

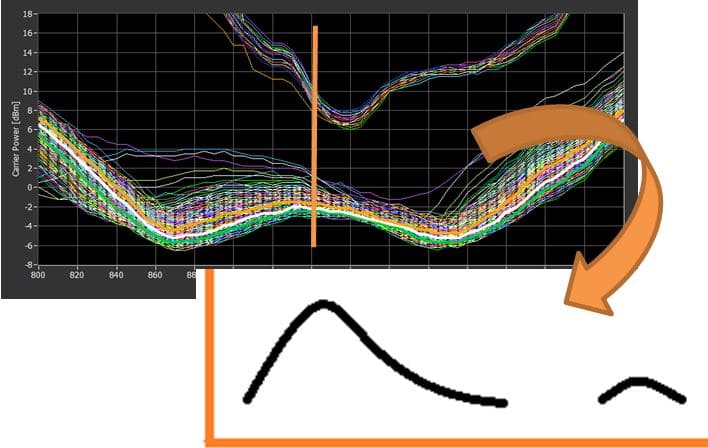
Developments in new RFID chips have changed the situation. Some tag models can be manufactured with normal distributed sensitivity variation. It is possible to implement Six Sigma quality control, maybe with 4-sigma limits to start with.

Contact us to arrange an online demo and to discuss more about quality control in RAIN RFID tag manufacturing!

Quality Testing Solution for RFID Label Production

Tagsurance 3 is the next-generation quality control solution for high-speed RFID inlay and label production lines.

All blog posts
All blog posts

Testing Requirements of NFC/RAIN RFID Dual Frequency Labels in Production

Jan 09, 2017

中文版 Chinese version

There are applications, where fast data collection and high read distances of RAIN RFID (UHF) tags fulfill the overall application requirements only partially. Especially the missing capability of a consumer to easily access the tag contents limits the usability for marketing, product information and authentication purposes. A NFC tag would remove that limitation but also induce additional costs and complexity to the label finishing stages: double encoding and possible data compliance verification between these two tags. Interestingly the first IC chip with both high frequency (HF) and ultra-high frequency (UHF) communication interface was launched in 2015 by EM Microelectronics. In this text I will take a closer look at the quality aspects of dual interface tags: How do you verify that each tag produced meets its specification?

Is It Sufficient to Test the Performance of Either Interface to Guarantee the Performance of the Tag?

Let’s dig into the tag structure a bit to understand more detailed where the performance comes from. The chip itself is one complete entity with two interfaces for each frequency. This allows conveniently accessing the memory locations of the chip through either HF/NFC interface using for example your mobile phone, or through UHF interface by for example the retail in-store inventory system. On the inlay level there are still two separate antennas; one that is used for HF coupling and the other for UHF field communication. Both of these antenna structures are connected to the IC through separate chip I/Os. Below we can see an example of such a tag design from Lab ID:

There is certainly some coherence in the process quality for both interfaces, as the antennas are both processed simultaneously, and a single chip is assembled to work with both, but is it enough to guarantee the good performance for both if only one interface is tested? Based on some further analysis on possible failure mechanisms, the answer to the question is

No, it is not!

NFC and RAIN Performance on a Dual Interface Label Needs to be Separately Tested

We ran some tests using both Tagsurance UHF and Tagsurance HF testers to identify less sensitive tags from a roll of dual frequency tag samples. The test setup for testing dual frequency tags consists of two separate Snoop Pro coupling elements – one for UHF testing and one for HF testing – and a Tagsurance unit connected to each of them.

One graphical user interface handles both testing units and gathers the test results and read data from each tag in a combined log file. Based on this information we were able to identify tags with lower performance either on UHF communication or in HF communication. In many failed samples the performance had decreased in both interfaces. In the graphs below we can see the UHF performance on upper graph and the HF performance on lower graph for a normal tag (white curve) and for a tag with decreased performance (red).

This is not always the case though, as we could also identify tags where one interface was performing good, but the other one was either not functional at all, or the performance was just significantly lower compared to normal level of variation in the sample set. In the graphs below there’s the UHF performance and the HF performance of four tags; one normal (white curve), one with decreased UHF performance and normal HF performance (blue) and one with decreased HF performance and normal UHF performance (green). There you can also find one tag with decreased UHF performance and HF performance slightly better than the typical tag (orange).

NFC/RAIN RFID Combo Test Solution Is Available

As always with disruptive new technology, it takes some time for the components and new manufacturing technologies to fully mature. As this brief study shows, the performance of either interface can vary independently of each other, even if they are integrated on the same IC. Therefore both interfaces should be tested in production.

Voyantic provides turn-key solutions for testing of all your RFID production. With our equipment you can test your RAIN RFD tag; HF/NFC tags with ISO 15693, ISO 14443A, ISO 14443B, Felica and ISO 18000 3M3 protocol; and dual frequency tags. We would be happy to tell you more and tailor the best suited solution for your exact requirements!

Download our new Application Note about testing of UHF, HF/NFC and dual frequency tags, giving a detailed understanding on the equipment and test setup used in production. Contact us to learn more!

Learn How to Test Dual Frequency Tags

Download our application note to learn how to get things right the first time when testing UHF RFID, HF/NFC and dual frequency tags!

All blog posts
All blog posts

Downgrading Your Spec Does Not Make a Quality Tag – Thoughts About RFID Quality

Jul 08, 2016

中文版 Chinese version

I work as the CEO of Voyantic, a company that specializes in RFID test and measurement equipment. Since our systems are used by hundreds of companies around the world, we often come across cases where a customer needs our help to verify that their tags work as they should. This is a story about a case where things went wrong.

Tagging Athletes in Cross-country Skiing

We got involved with a very interesting case a couple of years ago. A small RFID integrator that we have known for some time wanted to tag athletes in a cross-country skiing competition. The idea was to use RFID for timing the race. And you can guess that if someone spends several hours on the ski track, being left without a race time is definitely not an option.

Cross-country skiing is a healthy hobby and also a good application for RFID timing – Photo by Sorbis / Shutterstock.com

There are many different ways to tag athletes in timing solutions. Common approaches in running competitions include integrating the RFID tags to the race bibs or attaching them to the shoes of the runners. However, in this case, the chosen approach was to buy wrist-band tags and to attach them to the ankles of the skiers. The tags were read by fixed readers that were set up on the side of the tracks.

The integrator went through the specifications of several different wrist-band tags and finally contacted a fairly well known maker of specialty tags for some samples. The samples arrived the following week, and the integrator ran some field tests. Everything worked well. He was able to detect every skier that passed the reader antenna.

So the integrator decided to order the tags that he needed for his application. Once again, there was a timely delivery of correct amount of tags. However, when he started to build the application, he noticed that not all of the tags were working. A typical discussion between an unsatisfied customer and a worried supplier followed.

The conclusion was that all the supplied tags worked according to the specification.

The tag manufacturer tested both working and non-working tags attached to the wrist of whoever they considered to be their standard-human. All tags were readable from a distance of 2 m which was the specification. But they didn’t all work in the end application. How is this possible?

Analysis

We got involved with the case at this point. We were asked to take a look at the tag samples to try to understand what was going on. So we ran a performance test for the tags using the Tagformance measurement system. The results from the Threshold Sweep measurement are shown below.

Performance variations of wrist-band UHF RFID tags measured with the Tagformance system

We tested the tags in free air, so they were not attached to a wrist or an ankle. But even in this setup it is clearly visible that there are significant variations in the tuning and performance of the tags. So this is what we think happened:

  1. The integrator decided to use the tags differently from what the manufacturer had specified
  2. The first samples sent by the tag manufacturer performed clearly above the spec
  3. The integrator concluded that this tag will work in the application
  4. The next tag batch – even though still within the original spec – performed differently
  5. A part of the tags didn’t work.

So, it is very hard to point fingers in this case. But there is something that the RFID industry needs to improve in. The industry is already doing a decent job in reporting the performance of their tags, e.g. in expected read range. But I think there is a lot to improve in how performance variations are reported, because that is a key factor in building reliable RFID systems.

And what happened with the skiing competition? Did the integrator get the system to work? He did. But he had to manually test through the tags and hand-pick the ones that worked well enough. Hardly a perfect outcome but every skier got their time.

My company Voyantic specializes in test and measurement solutions for the RFID industry. Are you interested to learn more about RFID quality control? Download our sample quality test report and contact us.

White Paper: How to Minimize Quality Variation in RAIN RFID and NFC Smart Label Manufacturing

Learn the practical effects of quality variation and how to minimize it.

All blog posts
All blog posts

This Doesn’t Look Right – Should I Contact Technical Support?

Dec 11, 2015

What do you do if, one morning, a new light with some strange symbol is suddenly lit on your car’s dashboard? You probably pull over and start browsing the car owner manual. You may be a little worried. Did I do something wrong? Can I fix this myself, or does the car need to be serviced? How long will I need to survive without my car?
In the same way, your Tagformance, the RFID test system that you typically use every day may have a problem you need to solve. You may already be an experienced user, or maybe you have just recently started to work with the system. When a new error message pops up or you get unexpected measurement results, it’s just like with your car. What’s wrong? Should I contact Voyantic Technical Support?

The answer to the last question is yes. You should.

*‘No such thing as a stupid question’ is a common phrase with a long history, and it makes perfect sense to me. *

If you have a problem with anything, and there is a possibility to get it solved quickly by asking someone who can help you, why shouldn’t you? The one who asks the “stupid question” may be doing a service to everyone, including the vendor, by pointing out a visible improvement to the product.

Here are some more or less typical situations where you might wonder if you should contact the vendor or just carry on. Uncertainty: You are performing measurements that look nice and smooth, but deep down, you are still wondering whether the results are correct? Is there some bias in the device? Am I measuring the right way? By contacting Voyantic Technical Support, we can verify if the device is OK by comparing the reference tag measurement results with the same measurement setup. We can also measure your sample tags and give a second opinion of the results and maybe give pointers on what else you can measure from your tags.

Differences between sites: You may have a colleague in the next room or on the other side of the globe doing the same measurements that you are. The equipment may be the same, the setup may be identical, but still, your results don’t match completely. For example, you get a theoretical read range value of 11 meters, and your colleague measures 10 meters. One meter sounds like a lot, but is it after all? By looking at the measurement data, we can verify whether the difference is something to worry about, or if it fits into production variation and typical measurement accuracy. Other factors, such as temperature, may cause a difference. The effect of temperature is described in more detail in an Application Note, which can be downloaded here. While visiting the site, you may find other Application Notes worth reading too.

Missing features: Different Tagformance measurement options are enabled with the license file. We can create license files where any measurement option can be enabled for a given time. So, if you think that one or more options could be useful for your work, we can enable the option for a trial period. To name a few;

  • Scripter is a great tool to automate your daily measurement routines and reduce the human error from the results.
  • The Tagformance has two Application Programming Interfaces, APIs, that enable you to write your software that uses the Tagformance device. The LabVIEW API is a perfect match for LabVIEW users, and the DLL API serves users of other programming languages.
  • Memory management is a brand new tool for one of the hot topics, sensor tags, for example. With Memory management, it is possible to verify changes of any memory address content within seconds.

Memory Management

All this said, do not hesitate to contact us! In most cases, it is a win-win situation where you will get your problem solved or a question answered, and we get valuable feedback, which will help us in making our products even better. We are here to help you – send us a message!

All blog posts
All blog posts

How to Optimize the Cost of Quality for UHF Tags?

Sep 25, 2015

When talking about high-end RFID performance testing solutions, I sometimes face the situation, where my customer is struggling to find room for the investment in their budget. After some return on investment (ROI) calculation, the case typically looks much brighter.

If we look at the overall quality cost structure in UHF tag manufacturing, I will dare to claim that, in many cases, even a single batch of poor quality can justify the ROI for decent RFID test equipment. The challenge here is though that the costs of being able to provide excellent and consistent quality are directly addressed to the production. In contrast, the charges induced from poor quality are inconspicuously scattered all around the corporate structure.

Where do I base the claim? Let me show you!

First of all, to lower the cost of poor quality, you need to invest in preventing failures and maintaining excellent quality. The great thing here is, though, that you get much more than your money back. If done right, each penny you invest is multiplied as savings in failure costs. This is how you balance the scale and minimize your total costs.

Let’s Do Some Math!

When a quality issue is found in the production, how much does it cost for an engineering team to troubleshoot, or a machine to stand by waiting for the next production batch to be started? I’m sure you know the figures better than I do, but what I do know is these problems take some hours to be solved, sometimes even days. I also know that the one-hour machine downtime in chip attachment makes at least 10 000 tags less manufactured. For a label converting process, it may be ten times more.

What if the problem was not detected when manufacturing the tags, but in an inspection process that was done on the batch afterward? How big is your typical batch? 100 000 tags? 5 000 000 inlays? In the worst case, you need to multiply that with the number of batches produced and with material costs per tag, and add on top of the engineering work and machine downtime.

Ok, now you just need to rework the whole batch, which means again capacity loss, as the machine time is used to reproduce what already was supposed to be delivered. The ball keeps rolling, and you’ll end up with shortages in your next deliveries, delays that cause inconvenience to the customers, and a headache to the management, sales, and customer support. So, just add up the machine time for rework, management, and support time, as well as customer dissatisfaction with the earlier equation.

Now, we are starting to talk about costs that are far more difficult to quantify. Customer satisfaction…

What if the defected batch didn’t remain as an internal issue? What if it reached the customer, who is struggling now with problems in his application? Now we’re starting to talk about external failure costs, which are not only harder to be measured, but also induce secondary effects and costs, like bad quality reputation. I know, impossible to be quantified. But if you just add the management cost due to the complaints and troubleshooting with the customer involved, and forget the fact that the customer may end up ordering his next tags from another supplier, we still have a significant pile of costs due to poor quality. Now would you believe me when I’m saying:

You Need to Balance the Scale to Minimize the Overall Cost of Quality

Unlike the above figure may suggest, the equilibrium point here would not necessarily be where the cost of poor quality equals the cost of good quality. The equilibrium point is reached when the efficient investments in the price of excellent and consistent don’t return more than their value in the costs of poor quality.

The graph below would represent an example situation, where the costs of good quality are linearly increased, resulting in considerable reductions in the price of poor quality at first. Eventually, the point is reached, where further improving the quality appraisal and failure prevention costs will not lower the failure costs as much.

If you calculate with your figures the overall cost for providing just a single batch of UHF tags with inferior quality to the customer, would you agree with me that these costs are just too high to accept frequently, or at all? This approach is only the tip of an iceberg. What eventually will happen, if the quality continuously keeps failing to meet the customer expectations, is you start losing business, surreptitiously, but deterministically.

Quality Reputation – Hard to Estimate, Easy to Forget

The quality reputation is easier to ruin than to be built. Building it from scratch takes time and effort. Trying to gain customer trust without hard evidence based on measured facts is challenging. Still, if you’re able to quantify the quality, as well as prove the quality is consistent, you’re in a wholly different position to win the customer.

We have various examples of customers who have taken the UHF tag quality seriously, all the way from design to production. There are customers like Michelin, who have decades of experience in manufacturing and quality control. They have the same approach in case of any new technologies. Why ruin the quality reputation you have successfully built for years? With Michelin, we worked on something a bit customized to be able to test tire tags that are very heavily over-tuned. Check out this interesting case study:

Michelin — Tire Tags with Consistent Quality

Customer Case Studies

What kind of figures did you come up with on your overall cost of quality? Would you like to talk more about balancing your scale as well? Please contact us, and let’s figure out how we could lower your quality costs and increase your profitability! For the first 20 people to contact me, I promise to make free of charge tag measurements.

Solutions for RFID productions

All blog posts
All blog posts

National UHF RFID Standards and RFID Performance

Sep 14, 2015

ISO 18000-63 (6C, EPC Class 1 Gen 2) has been by far the most used UHF RFID standard for several years. There have been some competing standards such as Tagidu, IP-X (tag-talks-only), and ISO18000-62 (6B), but they are nowadays rarely used in new applications. However, new RFID standards still emerge: for example, in Brazil, SINIAV has created a protocol aimed for vehicle tracking applications. In China, a new UHF standard, GB/T29768-2013, has been recently published.

Several tag manufacturers work with these new standards. Why do these national RFID standards exist? And what does it mean for performance testing?

Why Doesn’t Everyone Work with the Same Standard?

Since there is a well-working global standard, it would sound logical to use it for as many applications as possible. But there are some reasons for using something else as well. There may be national interests, or maybe there are special requirements that existing standards don’t cover well enough. For example, ISO 18000-63 was developed for quickly inventorying large quantities of items, and it may not be optimal for reading a single tag that is passing by at 180 km/h. Another challenge may be when the tag is in the windshield of a truck filled with other tagged items.

It should also be noted that the division to separate standards does not always have to be final. Commonly, new functionalities and exclusive features are absorbed into the global standard after they are validated.

What is the Difference Between the Different Standards?

When we talk about passive UHF RFID, we talk about readers that radiate between 860 to 960 MHz to power up remote tags, which in turn modulate their reflection to communicate back to the reader. That is common between all passive UHF RFID standards.

The difference is in how the readers and tags modulate the electromagnetic waves, and what kind of command and response sequences are used in the communication.

One standard might be optimized for quick inventorying while another might provide added security.

Besides, the complexity of the protocol affects the power consumption of the chip and, thus, the read range that can be acquired.

What do the National Standards Mean for Tag Manufacturers

So how should a tag manufacturer respond to a customer’s request to make a tag for a less widely used UHF RFID standard? Well, that depends on the opportunity. But there is nothing to be afraid of in the design process – it is no different from ISO 18000-63 tags. The Voyantic Tagformance system supports performance testing of the GB and SINIAV protocols (as well as older ISO 18000-62 and IP-X protocols).

With the Tagformance system, it is quick to characterize a UHF RFID tag regardless of the protocol: just choose which protocol is to be used in testing and then start the selected test. Results include (but are not limited to) information about the tag sensitivity, read range, tuning, and radiation pattern.

Application Developers

New RFID standards are often used in new application areas. With the Voyantic’s Field Engineer’s Kit, RFID tags can be tested within the application – for example, when attached to a vehicle. Vehicles are an example of a quite challenging environment for RFID because of their large metal parts and a variety of different plastic and glass types where tags are mounted. Thus, field test results are crucial.

Typical field tests aim to verify the read range. The Tagformance system can be used in evaluating what kind of read range can be achieved with different readers – without actually using the readers. Based on the tag measurements and the reader information input by the reader, the system shows the achievable read range, but also which tag or reader parameter is the bottleneck for system performance.

Download the Tagformance Pro Catalogue

Learn more about the Voyantic Tagformance® Pro Test Device! By combining RAIN RFID and NFC testing into one compact test device, our all-new Tagformance Pro is a true all-in-one tool for anyone either developing or using RFID technology.

All blog posts
All blog posts

How to Improve Efficiency of the R&D Team in UHF Tag Design

Jul 23, 2015

中文版 Chinese version

Being responsible for sales of RFID performance measurement solutions, I’ve had the privilege of meeting with several companies and their design professionals around the world using very different methods for measuring UHF tag performance. Which is the best method then? I’d say it depends on your requirements – for a single essential measurement, you may use various methods, and even a simple technique can be sufficient. However, if you are looking for a way to improve the throughput and efficiency of your R&D team in tag design, the differences in methods are enormous. So, where does the efficiency come from?

The simplest method in UHF tag measurement is using an RFID reader to verify if the tag can be read from a certain distance or not. This pass/fail type of method is easy to do and fast for sure. However, most of the critical characteristics cannot be measured nor verified at all. Another commonly used way based on a set of generic measurement instruments like a signal generator, a network analyzer, and a power meter, is more advanced but unfortunately not anymore fast nor easy to use.

As the two methods introduced above are not ideal in the first place, neither of them can be the real solution to provide increased efficiency either – don’t worry, there is another approach available.

Purpose-built RFID Measurement System

In the R&D environment, most RFID measurements set high requirements for reliability, accuracy, and repeatability of the results and the test method itself. This is the case also in developing new UHF tag designs, thriving to the best possible performance, and at the same time balancing various requirements for different parameters. In this kind of environment the key questions are;

  • How quickly can a set of various measurements be performed?
  • Can the measurements be repeated automatically during the design iterations?
  • What are the possibilities in storing, analyzing, and sharing the results?
  • What kind of competence is required to perform the measurements?

The ideal solution addressing these requirements is a purpose-built RFID measurement system, providing an easy-to-use user interface, high measurement accuracy, compliance with standard RFID protocols, and wideband sweep capability.

How to Enhance the Efficiency of the R&D Team?

Ease-of-Use

There is inherent ease-of-use in the concept of a purpose-built measurement system, as there is only one tester device, including all the necessary accessories and an easy-to-use graphical user interface. A predefined measurement set-up procedure based on a reference tag ensures correct system start and exact measurement results.

Ease of use improves the efficiency of each user regardless of their technical competence. However, the real benefit comes out of the fact that also less experienced persons can easily be trained to perform extensive measurements without having in-depth RF knowledge.

One System – Several Measurements

A dedicated RFID measurement system includes all the necessary measurement functions presented in a pull-down menu with suggested default settings for each measurement. Wideband sweep measurement performed over a wide frequency range of e.g., 800 – 1000 MHz enables the flexible visual presentation of the tag detuning phenomenon on different materials compared with on-air results.

Measurement functions menu

One Measurement – Several Results

One single measurement, like the Threshold Sweep, provides several calculated results (e.g., Transmitted power, Backscattered power, Electrical Field Strength, and Theoretical Read Range) that can be viewed simply by selecting the desired result view from the Y-axis pull-down menu.

Results selection menu

Repeatability and Automation

Once the user has selected the function and started the measurement with relevant parameters, the test system provides the results that are stored in the results database with a timestamp and detailed information on all the parameters used in the measurement. Error-prone human interaction and handling of the results are avoided by automated calculation and management of the results.

The quality of the measurements can be further ensured by defining and storing a sequence of measurement commands (Scripter) for repeated use. Predefined script together with automatic rotation system eliminates human errors when performing e.g., orientation sensitivity measurements in various positions between 0 and 360 degrees. The example script below defines a sequence of two Threshold measurements and one Backscatter measurement.

Example of a measurement script

Conclusions

A purpose-built RFID measurement system combines high measurement accuracy, versatile measurement capability, and ease-of-use – a unique combination that cannot be achieved with traditional methods.

Accordingly, the improvement of the R&D team efficiency is based on:

  • Quick set-up of the system
  • Better visibility to the performance of the tag under test
  • More measurements in the time available
  • More tests on alternative tag designs in a shorter time
  • Avoiding human errors
  • Testing made it possible for non-RF specialist
  • Shorter time to market for new tag designs.

If you want to learn in detail how the Voyantic Tagformance UHF Measurement System can improve the efficiency of your organization, please download the Tagformance Catalogue below! 

Downlaod the Tagformance Pro Catalogue

Learn more about the Voyantic Tagformance® Pro Test Device! By combining RAIN RFID and NFC testing into one compact test device, our all-new Tagformance Pro is a true all-in-one tool for anyone either developing or using RFID technology.

All blog posts