Creating a tagging solution for passive RAIN RFID tags to a particular application starts with understanding the application specific requirements. That involves plenty of process engineering, but also typically discussions around the expected read range between tagged items and reader antennas. The read range is impacted by several factors and many start the cooking process by looking at the properties of RAIN RFID tags.
Tag datasheets carry plenty of information: protocol, operating frequency, chip type, memory utilization, physical size and much more. Amongst all information on datasheet, I reckon tag dimensions and read range are typically the first ones checked. Both are relatively easy values to understand, although the first one is a fact, and the second more an opinion. In the following I explain how to interpret the tag read range right.
Classic Approach: Take a Tag and Walk Away
The simplest way to get an idea of the read range is to place a reader to the end of a hall, take a tag and walk away from the reader antenna to see how far the tag can still be successfully read. In this kind of empirical test the result is not a fixed distance under which the reading would always be successful, but instead the result typically varies as below:
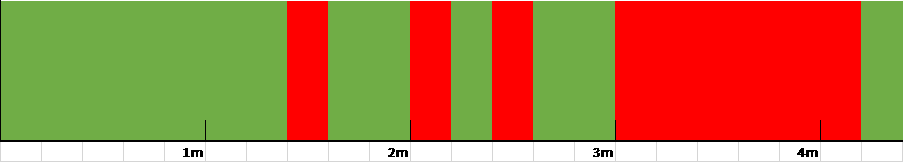
Obviously such a result leaves a problem: how to interpret the results? What in fact is the read range in this case? A bigger problem is that the result is actually a synthesis of so many factors, such as reader properties, tag alignment, other objects in the environment, illumination in the hall, settings in the reader… So, what was it again you wanted to see?
Very few halls, office spaces or basements are stable enough to reproduce the test from day to another with the same test result. Therefore, key delivered value of this approach is merely the physical exercise, and most vendors don’t use these results in their tag datasheets.
Laboratory vs. Real Life Performance
RFID measurement systems characterize tags at high precision after which read range is calculated based on a few assumptions. Laboratory measurements themselves are often performed in shielded and anechoic chambers to remove other variables from the test results, which greatly improves the value of the data and the repeatability of the test process.
This kind of measurement does not emulate effects of environment where tags are used. Experts talk of multipath propagation and path loss, and some others may talk of reflections, shadowing and interior design. No matter which definition is used, the environment is the grand source of differences between laboratory and real life performance.
Practical Difference of ERP and EIRP
Theoretical read range values plotted by the Tagformance system are based on the Tag Performance Parameters and Test Methods Version 1.1.2, 2008, EPCGlobal Inc. For the read range standard specifies 35dBm EIRP transmit power to be used in the calculation. 35dBm EIRP transmit power equals 33dBm ERP power. 33dBm ERP equals 2W and 35dBm EIRP equals 3.28W. If maximum power 4W EIRP is allowed, as in the FCC band, theoretical read range results can be obtained by adding 11% on the figures shown in the Tagformance software.
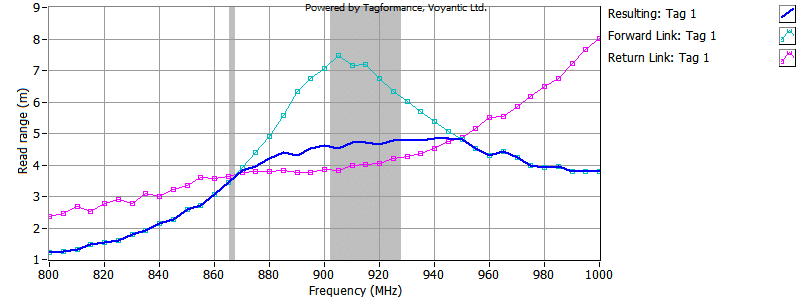
Forward Limited Read Range Is Not a Safe Assumption Anymore
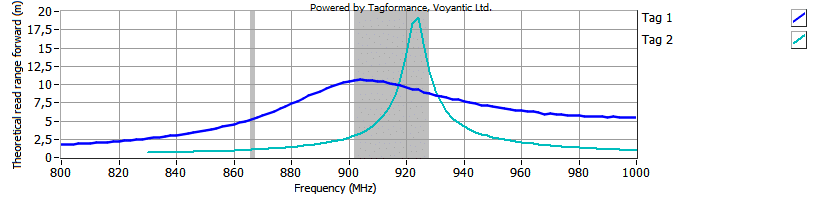
As tag dimensions shrink and tag ICs become more sensitive, readers often become the limiting factor of read range. A reader with more sensitive receiver is able to pick up a tag’s reply from greater distance. When read range is analyzed it is typical to separate read range to forward (up) and reverse (down) links.
Picture below shows forward and reverse read range curves, which are calculated using 1W ERP transmit power, 2dBi antenna gain and -65dBm receiver sensitivity.
Tag Close Coupling Issues to Be Addressed by TIPP
As tagging spreads to new product categories in the retail industry, small tagged items are often brought into close proximity to each other. Just think about items boxed for transport. Especially when the distance between tags is less than 3 cm, the tags start to couple with each other.
The close coupling effects will be considered in the upcoming GS1 TIPP global standard. Stay put for Juho Partanen’s upcoming blog post regarding these issues!
From Opinions Back to the Facts
As you saw from the above, the read range is a factor of many issues. As you work yourself through the tag and reader datasheets with the aid of expert tools and good standards, you can connect the dots with relative ease. This process transforms opinions into facts.
I’d appreciate your comments and suggestions around these topics. New perspectives are always welcome.

Learn How to Test the Read Range with Tagformance
Download our application note “Read Range Test with Voyantic Tagformance” to learn how easy it is to test the read range!