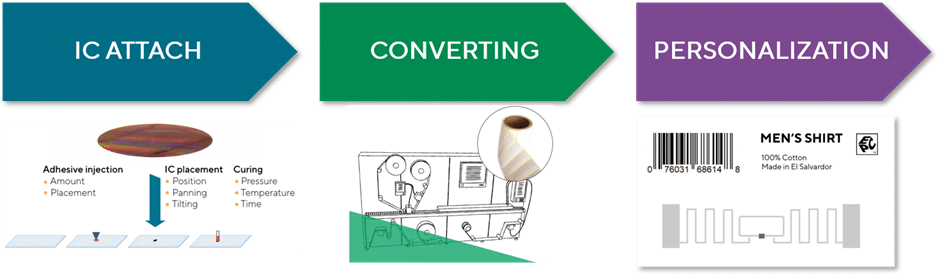
RAIN RFID, aka UHF RFID aka EPC RFID, is the technology used in connecting billions of everyday items to the Internet. In 2020 RAIN RFID tag volumes exceeded 21 billion, and in 2021 volumes reached over 28 billion. We are seeing this strong growth continue. As a result, huge amounts of new production capacity will be needed, which means that
- more machines are needed,
- single-lane machines need to be converted into multilane machines, and
- machine lane speeds must be increased.
At the same time, RAIN RFID users have started to pay more attention to their RFID label quality.
In this article, I will share Voyantic’s experiences and views on RAIN RFID quality testing:
- What is essential in planning quality testing in RAIN RFID label manufacturing?
- What are the current best practices in RFID quality testing?
What does good manufacturing quality mean for RAIN RFID tags?
At the very basic level, the good manufacturing quality of RAIN RFID tags could be defined as: “Manufactured RAIN RFID tags are not defective.” This definition is easily understandable, but it does not offer much practical help. In fact, it is misleading. Sometimes “not defective” is interpreted as “can be read”, and that leads to problems. When RAIN tags start to break, their read range gradually decreases and, only at the very end, the tags become entirely unreadable.
A better definition of good RAIN RFID manufacturing quality is: “Manufactured RAIN RFID tags’ sensitivities are within set variation limits”. This definition is a bit more technical, but let’s break it down:
- Tag sensitivity describes how much power is needed for waking up a tag. Tag sensitivity is at the background of all practical performance features. For example, if a tag’s read range has changed, also its sensitivity has changed. If a tag’s orientation pattern (read range in different angles) has changed, also the sensitivity has changed. If a tag’s response strength (backscatter) has changed, the sensitivity has also changed. Shortly – any change in a tag’s performance can be seen as a change in the tag’s sensitivity. Or the other way around – if the sensitivities of two individual tags of a model are the same, they will perform similarly in every way.
- Variation refers to consistency. Tag designs are different. Some tags are designed to have lower sensitivity (shorter read range) than others. The consistency of the performance within a tag model is important for the users.
- Within set limits implies that there are limits, but offers some freedom for setting the criteria. Some applications require exact read ranges – an item moving past a reader on a conveyer belt may require read ranges within some centimeters. Shorter range causes missed reads, and a longer range would risk stray readings – reading unwanted items that are not on the belt but nearby. Some applications have a higher tolerance, and a read range variation of a couple of meters may not be a problem.
RAIN RFID manufacturing quality is good when “Manufactured RAIN RFID tags’ sensitivities are within set variation limits”. This definition also works from a practical point of view.
What does the RF performance of RAIN RFID tags mean?
From a practical point of view, the RF performance of a RAIN RFID tag defines
- how far the tag is readable
- at different angles
- when the tag is attached to an item.
In tag datasheets, these are commonly described with graphs.
- An orientation pattern shows how well a tag can be read when it points to a reader from different angles.
- A threshold curve shows the tag sensitivity – how much power is needed to wake up the tag at different frequencies. A version of the threshold curve may show read range instead of power.
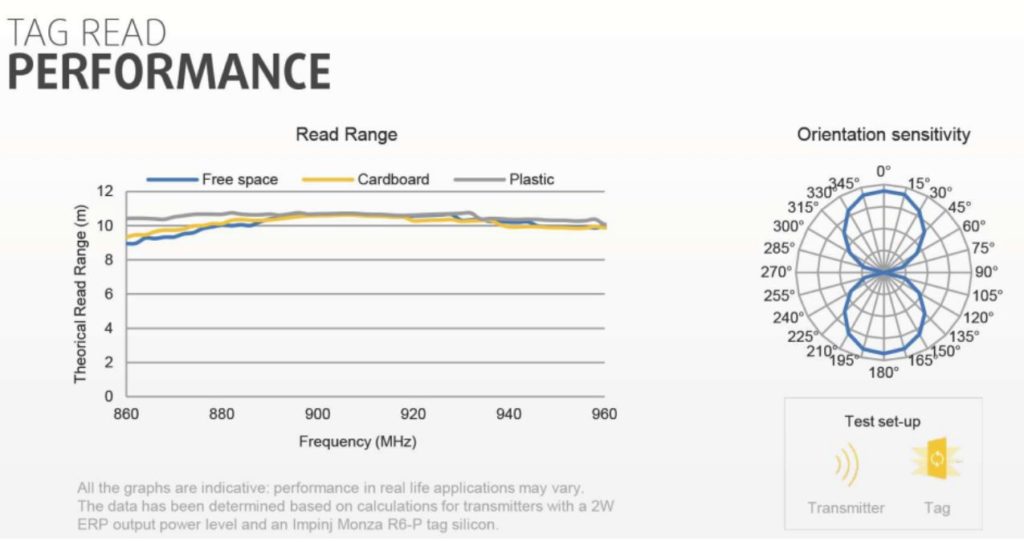
Good quality manufacturing produces tags that have consistently similar orientation patterns and threshold curves. The good news for manufacturers is that full measurement is not needed to check that the tags are similar to each other. In fact, this can be checked with minimal test procedures.
How should RAIN RFID tag quality be tested in manufacturing?
It should be kept in mind that one method does not fit everyone. However, RAIN RFID industry seems to be converging towards the following methodology.
These are the current best practices:
- Far-field performance of the tag is tested
- Test recipe that separates good and bad tags efficiently
- Cross reading is reliably prevented
These best practices may seem simple and obvious, but there are details to consider. Let’s look at these key points in detail.
1. Far-field performance of the tag is tested
In production machines tags are close to each other. Close proximity reading is needed for preventing cross-reading, and for practical reasons. At the same time, a quality test needs to address the far-field performance of the tag. A common near-field antenna cannot be used. Voyantic has solved this close proximity vs. far-field conflict with the patented Snoop Pro antenna concept. This unique antenna requires the tag to use its far-field properties in close proximity.
2. Test recipe that separates good and bad tags efficiently
Separating good and bad tags is an obvious requirement. But how to do it efficiently, at production speeds, when tags fly over the antenna at high speeds? A current best practice test recipe is often referred to as the “three-point test” or “3-point test”. The three-point test recipe includes
- testing the tag at three different frequencies across a wide frequency band (hence the 3-point test name)
- checking that the tag sensitivities are within 3 dB from each other (+/- 1.5 dB)
- checking that the tag’s EPC code can be inventoried
This is how the test recipe is created:
- A good starting point is to set test frequencies to 820 MHz, 950 MHz, and 1080 Mhz
- Adjust one of the points to match the tags’ lower resonance frequency
- If possible, adjust another frequency to match with the tags’ upper resonance frequency.
- select third frequency so that the frequency spread is at least 100 MHz
- at least one of the points should be an inventory test (for reading EPC)
- at least one of the frequencies should be a sensitivity test, with 3dB between upper and lower limits
- the power level for the points should be set so that tag sensitivity in each point is within 3 dB, or +/- 1.5 dB
Considering the recipe, this 3-point test could be described as the current industry best practice.
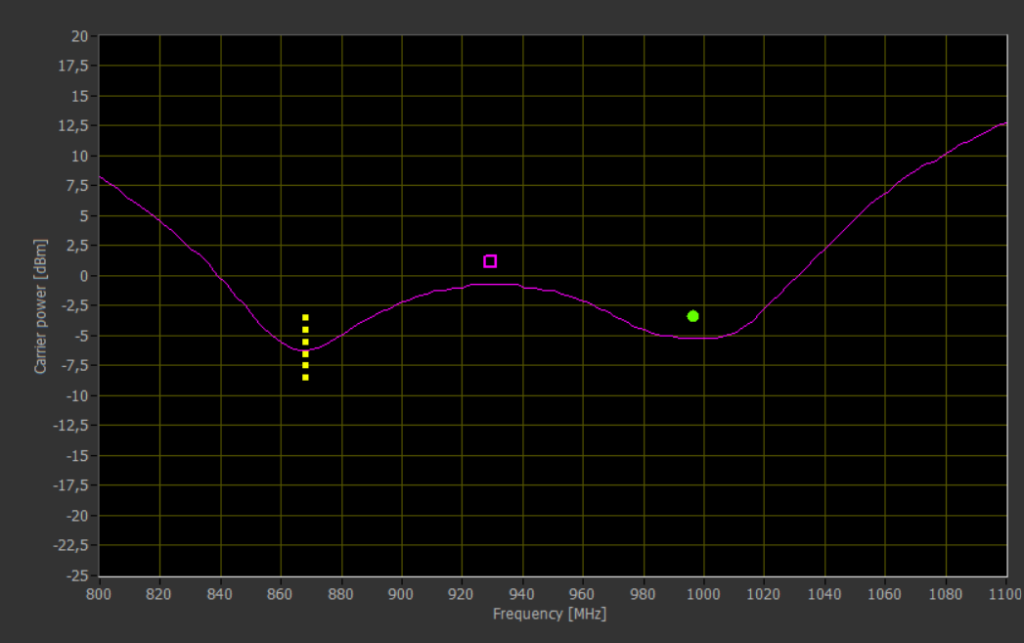
In the sample tag (above graph) both resonance frequencies (868 MHz and 995 MHz) are in the available frequency range. The sensitivity test is set to the lower resonance frequency and the point test is set to the upper resonance frequency. Because the frequency spread is over 100 MHz, the third frequency is set in between. An inventory test is set to this frequency.
In the above picture, the curve is a median performance tag’s threshold sensitivity curve (reference).
Shows sensitivity test frequency and power range, in addition, a 3 dB range is set for the acceptance criteria. the frequency is set to the lower resonance frequency. | ||
Shows the point test frequency and power. The power level is set 1.5 dB above the threshold of a median performance tag. | ||
Shows the Inventory test frequency and power (for reading EPC/UII code). |
3. Prevent cross-reading
Cross-reading occurs when one tag is thought to be read, but in fact, data comes from another, nearby tag.
In normal use, RAIN RFID tags are inventoried. They are read with a speed of more than a hundred tags per second. Testing production quality is different. Tags are tested one at a time, and it is critical to be sure that the results are from the right tag, even if another tag is just millimeters away. And to add to the complexity, all has to happen while the tags move at high speeds across the antenna.
Voyantic’s Snoop Pro antenna concept includes a method for completely preventing cross-readings. The antenna concept includes a shielding plate with dimensions matched to the inlay’s antenna and repeat length dimensions. This solution assures that cross-readings do not occur.
In addition to the above comments, 2 more notes can be added from the manufacturing point of view.
4. Speed
Production is about the combination of speed, capacity, and quality. Quality testing UHF RFID tags should not be the bottleneck for production. If any machine output needs to be limited because of quality testing, this would add to the cost of quality.
Voyantic Tagsurance 3 system is designed for high-speed production lines, for continuous production use.
5. Automation
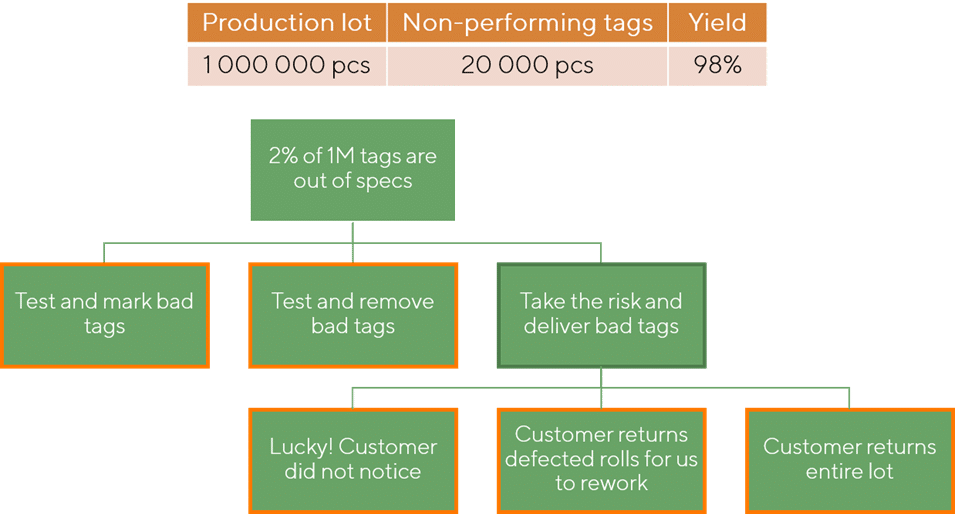
RAIN RFID tags are manufactured in volumes in different machines. Production runs are in millions, and any sample testing is not possible in practice. A common requirement is that tags of unknown quality are not accepted, this forces testing to cover 100% of the manufactured tags.
The testing must be automated and integrated into the manufacturing machine.
Voyantic Tagsurance 3 system can be easily integrated into any machine.
Are there quality standards or specifications to follow? What about quality certifications?
Common quality standards and practices such as ISO9000 series standards and six sigma can be applied to RAIN RFID. However, these standards do not offer practical advice on acceptable quality limits.
Exact quality limits have emerged within the RAIN RFID industry. The above-mentioned three-point test and tag sensitivity variation within 3dB is a commonly accepted good practice.
ARC RFID lab is offering quality certification for UHF RFID / RAIN RFID inlay manufacturers as a part of their tag certification program. Correctly implemented three-point test using Voyantic Tagsurace system meets these requirements.
The 3dB variation and three-point testing cannot be used every time – adjustments may be needed. The quality requirements arise from the RAIN RFID / UHF RFID users’ consistency requirements. If an RFID user needs very tight read range tolerances, a smaller variation limit may be needed, and in some cases, wider tolerances may be perfect for the customer.
Learn more about the Tagsurance 3 System

On-Demand Webinar: RAIN RFID 101 for Label Converters
Watch the 60-minute crash course on RFID essentials
Why are your customers talking about RFID now? What specifically is RAIN RFID? How can you get going? What do you need to consider to avoid claims and rework?